

Cookie, brownie, with icing or filling
Common food
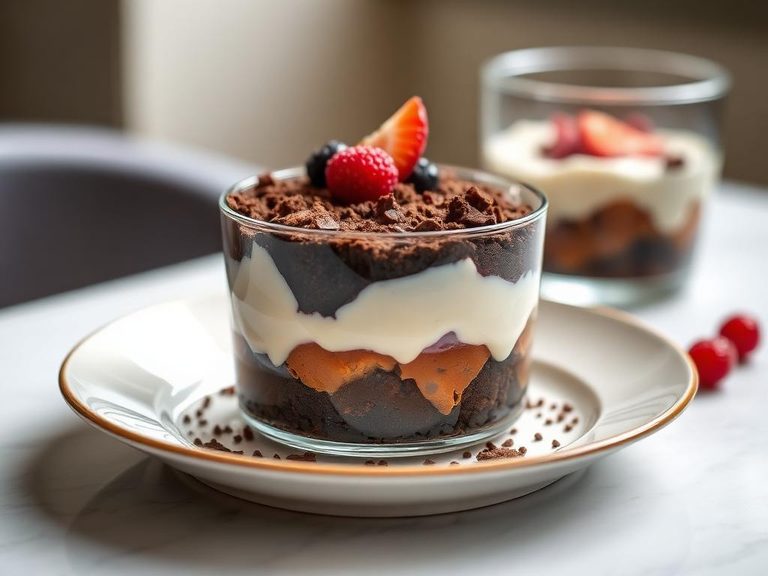
A dense, fudgy chocolate brownie with a smooth, sweet icing or creamy filling, offering a rich, decadent experience. Its texture is a perfect balance between a chewy crumb and a velvety topping. Nutritionally, it's a high-energy treat, packing over 400 kcal and nearly 50g of sugar per 100g.
Calorie split: 3% protein · 61% carbs · 36% fat
↓ Full nutrition💚 Why it's loved
People adore the intense chocolate flavor and the textural contrast between the dense brownie and the smooth icing. It's a beloved comfort food, often associated with celebrations, baking traditions, and nostalgic homemade treats.
⚠️ Watch-outs & how to enjoy it better
The very high sugar and refined carbohydrate content can lead to rapid blood-sugar spikes and subsequent crashes. Those managing blood sugar, calorie intake, or with gluten/dairy allergies should be cautious. To counteract this, enjoy a small portion alongside a source of protein (like nuts or Greek yogurt) or healthy fat to slow sugar absorption.
Key benefits
- Provides a quick source of energy from carbohydrates.
- Contains small amounts of protein from flour and eggs.
- Can serve as a satisfying treat for special occasions.
- Offers a morale-boosting psychological reward.
🍽️ Popular dishes
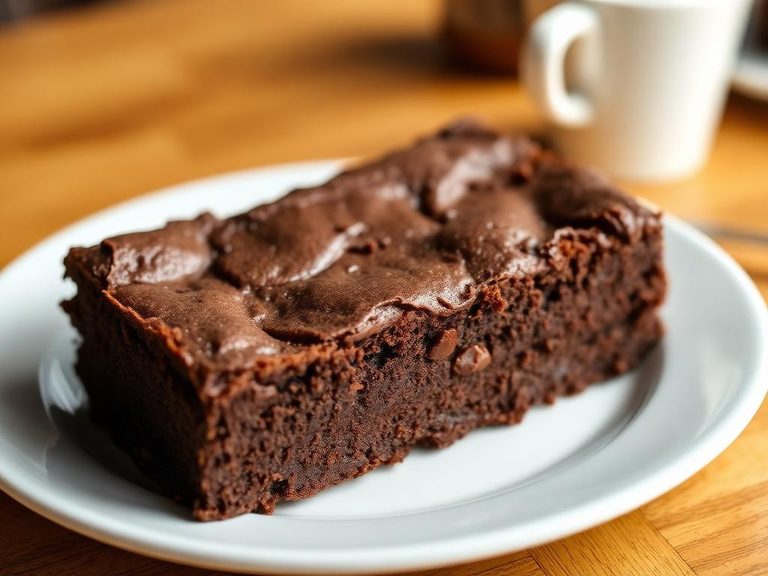
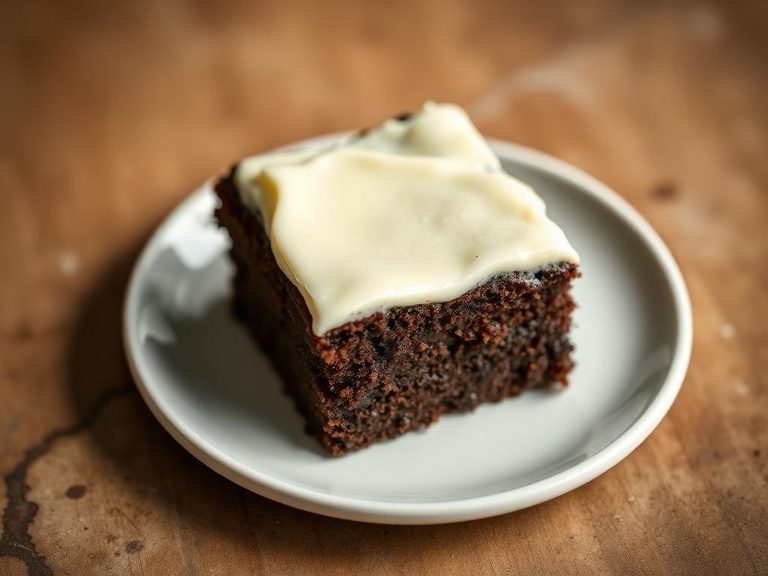
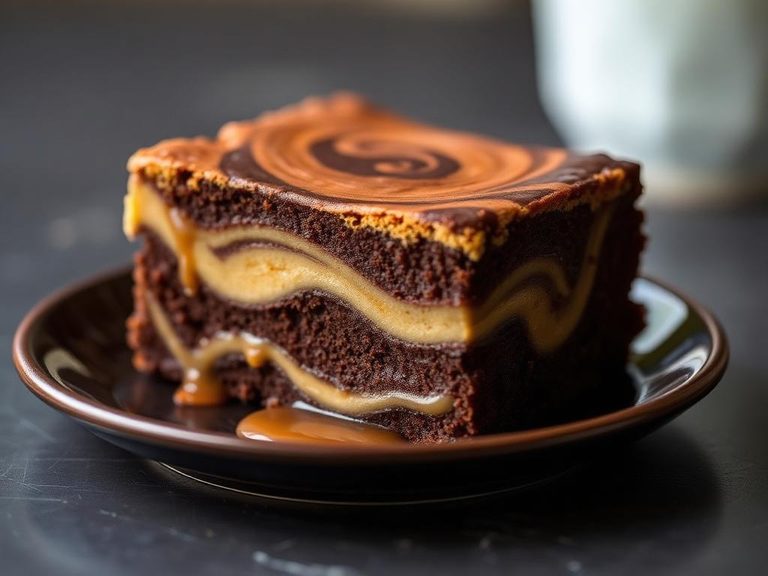
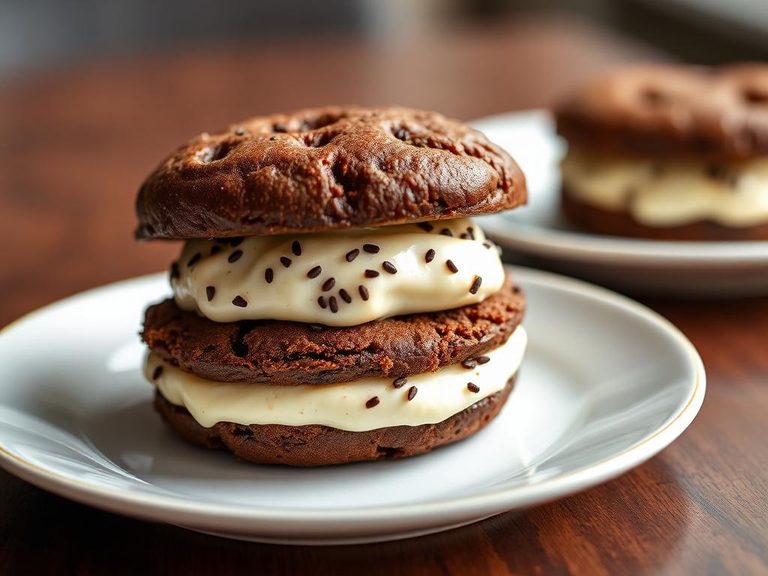
🌍 Where it's eaten
💡 Did you know?
The brownie was likely invented in the United States in the late 19th century, with the first known recipe appearing in a 1897 Boston cookbook.
Full nutrition (USDA data · scales with serving)
| Water | 15.3 g |
| Energy | 401 kcal |
| Protein | 2.9 g |
| Total lipid (fat) | 16.9 g |
| Carbohydrate, by difference | 63.5 g |
| Fiber, total dietary | 1.5 g |
| Total Sugars | 47.2 g |
| Calcium, Ca | 18.0 mg |
| Iron, Fe | 1.8 mg |
| Magnesium, Mg | 26.0 mg |
| Phosphorus, P | 90.0 mg |
| Potassium, K | 173 mg |
| Sodium, Na | 234 mg |
| Zinc, Zn | 0.50 mg |
| Copper, Cu | 0.21 mg |
| Selenium, Se | 3.5 ug |
| Vitamin C, total ascorbic acid | 0.00 mg |
| Thiamin | 0.13 mg |
| Riboflavin | 0.11 mg |
| Niacin | 0.92 mg |
| Vitamin B-6 | 0.02 mg |
| Folate, total | 24.0 ug |
| Folic acid | 17.0 ug |
| Folate, food | 6.0 ug |
| Folate, DFE | 36.0 ug |
| Choline, total | 8.4 mg |
| Vitamin B-12 | 0.04 ug |
| Vitamin B-12, added | 0.00 ug |
| Vitamin A, RAE | 10.0 ug |
| Retinol | 10.0 ug |
| Carotene, beta | 0.00 ug |
| Carotene, alpha | 0.00 ug |
| Cryptoxanthin, beta | 0.00 ug |
| Lycopene | 0.00 ug |
| Lutein + zeaxanthin | 3.0 ug |
| Vitamin E (alpha-tocopherol) | 0.86 mg |
| Vitamin E, added | 0.00 mg |
| Vitamin D (D2 + D3) | 0.00 ug |
| Vitamin K (phylloquinone) | 3.2 ug |
| Alcohol, ethyl | 0.00 g |
| Caffeine | 2.0 mg |
| Theobromine | 79.0 mg |
Fat & fatty acid profile (per 100g)
| Fatty acids, total saturated | 4.9 g |
| SFA 4:0 | 0.00 g |
| SFA 6:0 | 0.00 g |
| SFA 8:0 | 0.00 g |
| SFA 10:0 | 0.00 g |
| SFA 12:0 | 0.00 g |
| SFA 14:0 | 0.09 g |
| SFA 16:0 | 2.3 g |
| SFA 18:0 | 2.5 g |
| Fatty acids, total monounsaturated | 9.0 g |
| MUFA 16:1 | 0.01 g |
| MUFA 18:1 | 9.0 g |
| MUFA 20:1 | 0.00 g |
| MUFA 22:1 | 0.00 g |
| Fatty acids, total polyunsaturated | 2.2 g |
| PUFA 18:2 | 2.1 g |
| PUFA 18:3 | 0.13 g |
| PUFA 18:4 | 0.00 g |
| PUFA 20:4 | 0.00 g |
| PUFA 20:5 n-3 (EPA) | 0.00 g |
| PUFA 22:5 n-3 (DPA) | 0.00 g |
| PUFA 22:6 n-3 (DHA) | 0.00 g |
| Cholesterol | 8.0 mg |
Amino acid profile (per 100g)
Estimated from Pie Crust, Cookie-type, Chocolate, Ready Crust — USDA does not publish this profile for Cookie.
| Tryptophan | 0.08 g |
| Threonine | 0.20 g |
| Isoleucine | 0.23 g |
| Leucine | 0.38 g |
| Lysine | 0.24 g |
| Methionine | 0.07 g |
| Cystine | 0.11 g |
| Phenylalanine | 0.28 g |
| Tyrosine | 0.16 g |
| Valine | 0.32 g |
| Arginine | 0.29 g |
| Histidine | 0.11 g |
| Alanine | 0.24 g |
| Aspartic acid | 0.45 g |
| Glutamic acid | 1.3 g |
| Glycine | 0.24 g |
| Proline | 0.42 g |
| Serine | 0.26 g |
FAQ
What's the difference between a brownie and a chocolate cake?
Brownies are denser, fudgier, and use a higher ratio of fat (butter, chocolate) to flour, resulting in a rich, chewy texture, unlike the lighter, airier crumb of a cake.
Can I make a brownie with icing gluten-free?
Yes, by using a gluten-free flour blend (like almond or a 1-to-1 baking flour) in the brownie base and ensuring your icing ingredients are certified gluten-free.
Why does my brownie icing get too hard?
This often happens if the brownie wasn't completely cool before icing, causing the icing to melt and then re-harden. Always let brownies cool fully, and consider a glaze or ganache for a softer set.
Nutrient density (calculated · NRF9.3)
Nutrient Rich Foods index: beneficial nutrients (protein, fiber, vitamins, minerals) minus saturated fat, added sugar & sodium, per 100 kcal.
NRF9.3 index — Fulgoni, Keast & Drewnowski, 2009. Computed from USDA nutrients.
Weight-loss friendliness (composite index)
Energy density 4.01 kcal/g · 3% calories from protein · 1.5 g fiber · 47.2 g sugar per 100 g.
Composite of energy density (Rolls et al., 1999), protein & fiber satiety, minus sugar. A calculated heuristic — ranks satiety-per-calorie, not a clinical measure.
Dietary load (calculated from USDA values)
Potential renal acid load. Positive = acid-forming, negative = alkaline-forming.
Sodium-to-potassium ratio: 1.35 (lower is better — aim for ≤ 1)
Sodium:potassium per WHO potassium guidance. Computed from USDA nutrients.