

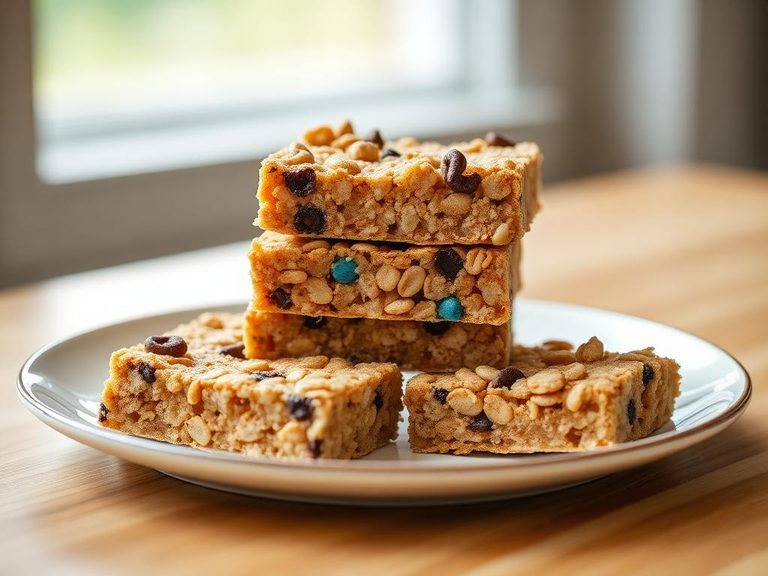
Cookie bar, with chocolate, nuts, and graham crackers
Common food

Photo: Wikipedia
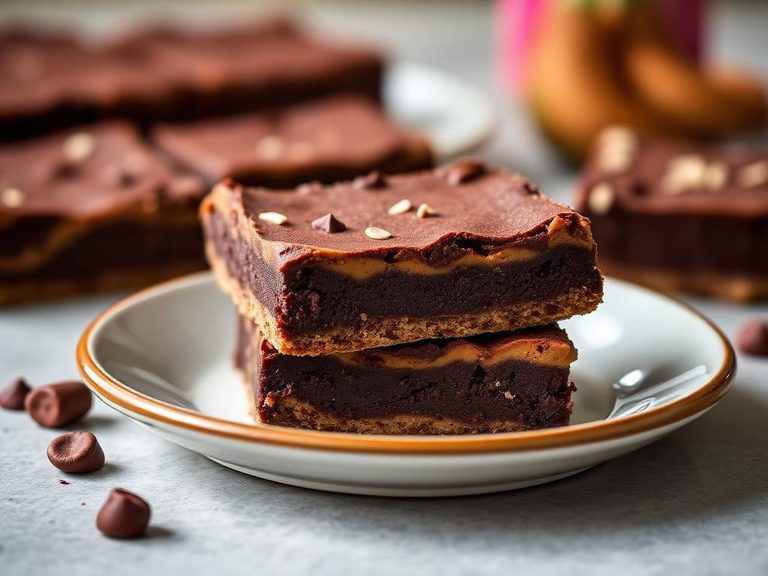
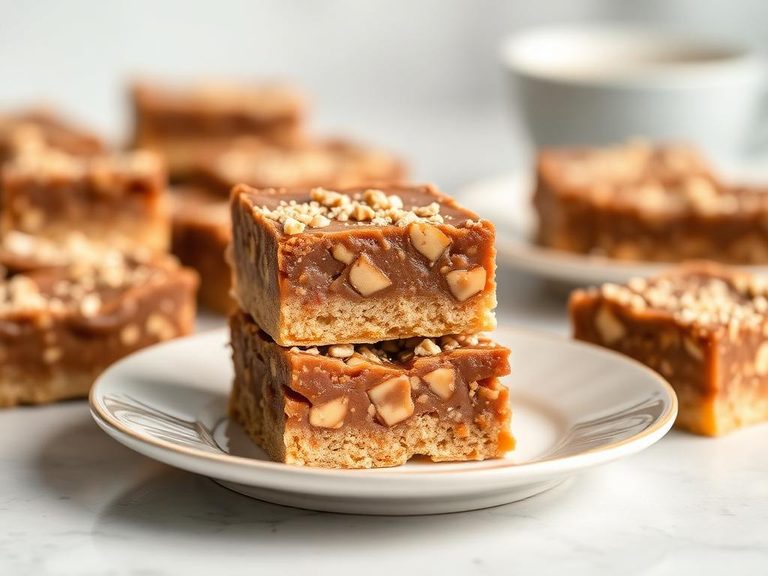
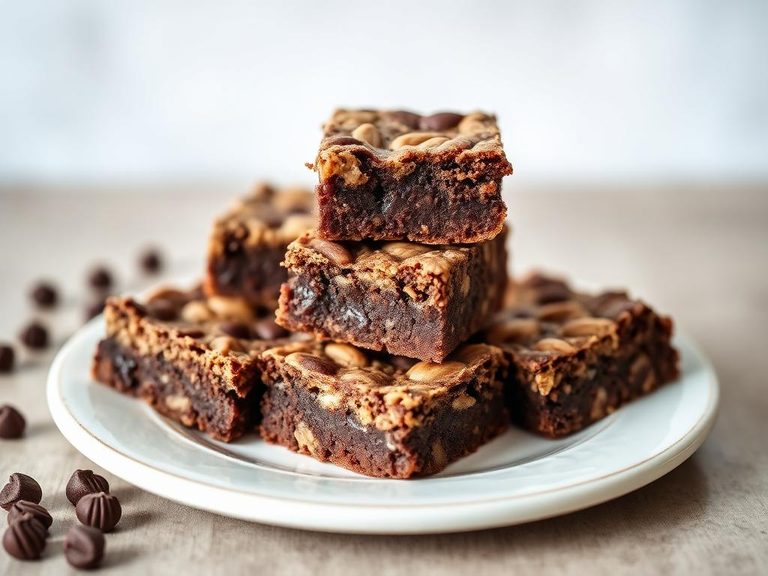
A dense, chewy bar made from crushed graham crackers, chocolate chips, and nuts, bound together into a sweet, no-bake treat. It delivers a satisfying crunch from the nuts and a smooth, sweet melt from the chocolate, all on a buttery, honey-kissed graham cracker base. Nutritionally, it's a high-energy, carbohydrate-dense snack with significant sugar content.
Calorie split: 4% protein · 52% carbs · 44% fat
↓ Full nutrition💚 Why it's loved
People love it for the nostalgic, comforting combination of honey-sweet graham, rich chocolate, and crunchy nuts. It's a versatile, crowd-pleasing dessert or snack that requires no baking and travels well.
⚠️ Watch-outs & how to enjoy it better
The high sugar and refined carbohydrate content can lead to blood-sugar spikes and subsequent crashes. It is also calorie-dense and contains common allergens like nuts, wheat (gluten), and dairy (if using milk chocolate). To mitigate, pair a small portion with a source of protein or healthy fat (like Greek yogurt or a handful of plain nuts) to slow sugar absorption, and practice strict portion control.
Key benefits
- Quick source of energy from carbohydrates
- Contains some plant-based protein from nuts
- Provides dietary fats for satiety
- Convenient, portable snack format
- Offers a satisfying sweet treat
🍽️ Popular dishes
🌍 Where it's eaten
💡 Did you know?
The graham cracker itself was invented in 1829 by a Presbyterian minister named Sylvester Graham, who believed this coarse, unsweetened flour bread would curb unhealthy appetites.
Full nutrition (USDA data · scales with serving)
| Water | 3.6 g |
| Energy | 492 kcal |
| Protein | 5.1 g |
| Total lipid (fat) | 24.7 g |
| Carbohydrate, by difference | 65.4 g |
| Fiber, total dietary | 2.0 g |
| Total Sugars | 32.9 g |
| Calcium, Ca | 21.0 mg |
| Iron, Fe | 5.6 mg |
| Magnesium, Mg | 41.0 mg |
| Phosphorus, P | 109 mg |
| Potassium, K | 171 mg |
| Sodium, Na | 311 mg |
| Zinc, Zn | 0.72 mg |
| Copper, Cu | 0.32 mg |
| Selenium, Se | 3.9 ug |
| Vitamin C, total ascorbic acid | 0.00 mg |
| Thiamin | 0.29 mg |
| Riboflavin | 0.30 mg |
| Niacin | 2.7 mg |
| Vitamin B-6 | 0.06 mg |
| Folate, total | 72.0 ug |
| Folic acid | 29.0 ug |
| Folate, food | 43.0 ug |
| Folate, DFE | 92.0 ug |
| Choline, total | 10.5 mg |
| Vitamin B-12 | 0.03 ug |
| Vitamin B-12, added | 0.00 ug |
| Vitamin A, RAE | 0.00 ug |
| Retinol | 0.00 ug |
| Carotene, beta | 0.00 ug |
| Carotene, alpha | 0.00 ug |
| Cryptoxanthin, beta | 0.00 ug |
| Lycopene | 0.00 ug |
| Lutein + zeaxanthin | 1.0 ug |
| Vitamin E (alpha-tocopherol) | 2.0 mg |
| Vitamin E, added | 0.00 mg |
| Vitamin D (D2 + D3) | 0.00 ug |
| Vitamin K (phylloquinone) | 33.7 ug |
| Alcohol, ethyl | 0.00 g |
| Caffeine | 11.0 mg |
| Theobromine | 83.0 mg |
Fat & fatty acid profile (per 100g)
| Fatty acids, total saturated | 8.1 g |
| SFA 4:0 | 0.00 g |
| SFA 6:0 | 0.00 g |
| SFA 8:0 | 0.00 g |
| SFA 10:0 | 0.01 g |
| SFA 12:0 | 0.01 g |
| SFA 14:0 | 0.06 g |
| SFA 16:0 | 4.5 g |
| SFA 18:0 | 3.3 g |
| Fatty acids, total monounsaturated | 6.3 g |
| MUFA 16:1 | 0.03 g |
| MUFA 18:1 | 6.2 g |
| MUFA 20:1 | 0.03 g |
| MUFA 22:1 | 0.01 g |
| Fatty acids, total polyunsaturated | 8.4 g |
| PUFA 18:2 | 7.5 g |
| PUFA 18:3 | 0.88 g |
| PUFA 18:4 | 0.00 g |
| PUFA 20:4 | 0.01 g |
| PUFA 20:5 n-3 (EPA) | 0.00 g |
| PUFA 22:5 n-3 (DPA) | 0.00 g |
| PUFA 22:6 n-3 (DHA) | 0.00 g |
| Cholesterol | 0.00 mg |
Amino acid profile (per 100g)
Estimated from Cookies, fig bars — USDA does not publish this profile for Cookie bar.
| Tryptophan | 0.05 g |
| Threonine | 0.11 g |
| Isoleucine | 0.13 g |
| Leucine | 0.22 g |
| Lysine | 0.14 g |
| Methionine | 0.05 g |
| Cystine | 0.07 g |
| Phenylalanine | 0.14 g |
| Tyrosine | 0.12 g |
| Valine | 0.15 g |
| Arginine | 0.12 g |
| Histidine | 0.07 g |
| Alanine | 0.15 g |
| Aspartic acid | 0.39 g |
| Glutamic acid | 0.91 g |
| Glycine | 0.12 g |
| Proline | 0.35 g |
| Serine | 0.19 g |
FAQ
Is this a baked or no-bake dessert?
It is most commonly a no-bake dessert, where ingredients are mixed and pressed into a pan to set in the refrigerator. Some variations may be baked.
Can I make it gluten-free?
Yes, by using certified gluten-free graham crackers or a similar gluten-free cookie base as a substitute.
Why is the sugar content so high?
The sugar comes from multiple sources: added sugar in the binding syrup (like honey or corn syrup), sugar in the chocolate chips, and the naturally sweetened graham crackers themselves.
Nutrient density (calculated · NRF9.3)
Nutrient Rich Foods index: beneficial nutrients (protein, fiber, vitamins, minerals) minus saturated fat, added sugar & sodium, per 100 kcal.
NRF9.3 index — Fulgoni, Keast & Drewnowski, 2009. Computed from USDA nutrients.
Weight-loss friendliness (composite index)
Energy density 4.92 kcal/g · 4% calories from protein · 2.0 g fiber · 32.9 g sugar per 100 g.
Composite of energy density (Rolls et al., 1999), protein & fiber satiety, minus sugar. A calculated heuristic — ranks satiety-per-calorie, not a clinical measure.
Dietary load (calculated from USDA values)
Potential renal acid load. Positive = acid-forming, negative = alkaline-forming.
Sodium-to-potassium ratio: 1.82 (lower is better — aim for ≤ 1)
Sodium:potassium per WHO potassium guidance. Computed from USDA nutrients.