

Ice cream cone, scooped, chocolate, waffle cone
Common food

Photo: Wikipedia
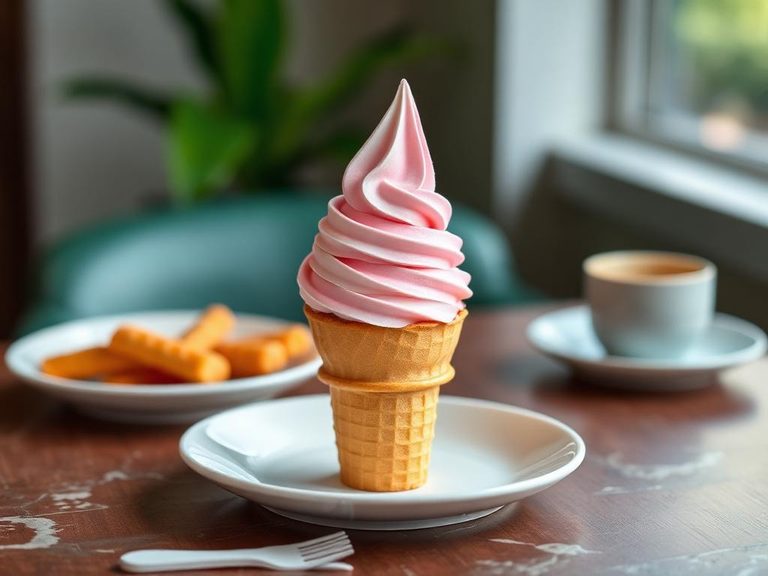
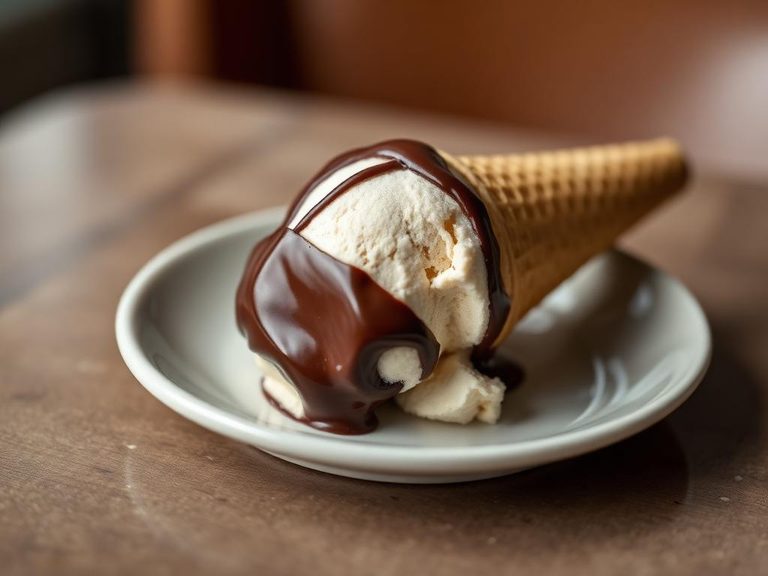
A crispy, golden waffle cone cradling a scoop of rich, creamy chocolate ice cream. The cone offers a satisfying crunch and a hint of caramelized sweetness, while the ice cream delivers a deep cocoa flavor and a smooth, melting texture. Nutritionally, it's a treat primarily composed of carbohydrates and fats, with a modest amount of protein.
Calorie split: 7% protein · 53% carbs · 40% fat
↓ Full nutrition💚 Why it's loved
People adore the perfect contrast between the cold, creamy ice cream and the crunchy, edible cone. It's a nostalgic, portable treat that combines convenience with the universal appeal of chocolate and a satisfying textural experience.
⚠️ Watch-outs & how to enjoy it better
The high sugar and refined carbohydrate content can lead to rapid blood sugar spikes. Those with lactose intolerance or dairy allergies should be cautious. To mitigate, enjoy a smaller portion, pair it with a handful of nuts for added protein and fat, or choose a brand with lower sugar content.
Key benefits
- Provides quick energy from carbohydrates.
- Contains calcium from the dairy-based ice cream.
- Offers a small amount of protein for muscle support.
- Can be a source of dietary fat for satiety.
- Often enjoyed as a portion-controlled dessert.
🍽️ Popular dishes

🌍 Where it's eaten
💡 Did you know?
The edible waffle cone was reportedly invented at the 1904 St. Louis World's Fair when a Syrian pastry maker ran out of dishes and rolled up his waffles to hold ice cream.
Full nutrition (USDA data · scales with serving)
| Water | 52.6 g |
| Energy | 227 kcal |
| Protein | 4.0 g |
| Total lipid (fat) | 10.6 g |
| Carbohydrate, by difference | 31.5 g |
| Fiber, total dietary | 1.2 g |
| Total Sugars | 25.4 g |
| Calcium, Ca | 105 mg |
| Iron, Fe | 1.1 mg |
| Magnesium, Mg | 29.0 mg |
| Phosphorus, P | 107 mg |
| Potassium, K | 243 mg |
| Sodium, Na | 89.0 mg |
| Zinc, Zn | 0.59 mg |
| Copper, Cu | 0.14 mg |
| Selenium, Se | 2.6 ug |
| Vitamin C, total ascorbic acid | 0.70 mg |
| Thiamin | 0.07 mg |
| Riboflavin | 0.21 mg |
| Niacin | 0.51 mg |
| Vitamin B-6 | 0.06 mg |
| Folate, total | 23.0 ug |
| Folic acid | 8.0 ug |
| Folate, food | 15.0 ug |
| Folate, DFE | 29.0 ug |
| Choline, total | 21.7 mg |
| Vitamin B-12 | 0.27 ug |
| Vitamin B-12, added | 0.00 ug |
| Vitamin A, RAE | 111 ug |
| Retinol | 109 ug |
| Carotene, beta | 18.0 ug |
| Carotene, alpha | 0.00 ug |
| Cryptoxanthin, beta | 0.00 ug |
| Lycopene | 0.00 ug |
| Lutein + zeaxanthin | 1.0 ug |
| Vitamin E (alpha-tocopherol) | 0.29 mg |
| Vitamin E, added | 0.00 mg |
| Vitamin D (D2 + D3) | 0.20 ug |
| Vitamin K (phylloquinone) | 0.40 ug |
| Alcohol, ethyl | 0.00 g |
| Caffeine | 3.0 mg |
| Theobromine | 58.0 mg |
Fat & fatty acid profile (per 100g)
| Fatty acids, total saturated | 6.4 g |
| SFA 4:0 | 0.32 g |
| SFA 6:0 | 0.19 g |
| SFA 8:0 | 0.11 g |
| SFA 10:0 | 0.24 g |
| SFA 12:0 | 0.27 g |
| SFA 14:0 | 1.0 g |
| SFA 16:0 | 2.9 g |
| SFA 18:0 | 1.4 g |
| Fatty acids, total monounsaturated | 3.1 g |
| MUFA 16:1 | 0.23 g |
| MUFA 18:1 | 2.9 g |
| MUFA 20:1 | 0.00 g |
| MUFA 22:1 | 0.00 g |
| Fatty acids, total polyunsaturated | 0.47 g |
| PUFA 18:2 | 0.32 g |
| PUFA 18:3 | 0.15 g |
| PUFA 18:4 | 0.00 g |
| PUFA 20:4 | 0.00 g |
| PUFA 20:5 n-3 (EPA) | 0.00 g |
| PUFA 22:5 n-3 (DPA) | 0.00 g |
| PUFA 22:6 n-3 (DHA) | 0.00 g |
| Cholesterol | 32.0 mg |
Amino acid profile (per 100g)
Estimated from Ice creams, vanilla, rich — USDA does not publish this profile for Ice cream cone.
| Tryptophan | 0.04 g |
| Threonine | 0.14 g |
| Isoleucine | 0.18 g |
| Leucine | 0.30 g |
| Lysine | 0.25 g |
| Methionine | 0.08 g |
| Cystine | 0.03 g |
| Phenylalanine | 0.15 g |
| Tyrosine | 0.14 g |
| Valine | 0.20 g |
| Arginine | 0.14 g |
| Histidine | 0.08 g |
| Alanine | 0.14 g |
| Glutamic acid | 0.65 g |
| Glycine | 0.15 g |
| Proline | 0.34 g |
| Serine | 0.17 g |
FAQ
Is an ice cream cone a good source of protein?
It provides a modest amount of protein (around 4g per 100g), mainly from the dairy in the ice cream, but it is not considered a significant protein source.
Why does the waffle cone taste sweeter than a sugar cone?
Waffle cones are typically made with a batter containing more sugar and butter, which caramelizes during baking, giving them a richer, sweeter flavor and a more delicate, lace-like texture.
Can I find gluten-free waffle cones?
Yes, gluten-free versions made from alternative flours like rice or almond flour are available, though they may have a different texture and crunch.
Nutrient density (calculated · NRF9.3)
Nutrient Rich Foods index: beneficial nutrients (protein, fiber, vitamins, minerals) minus saturated fat, added sugar & sodium, per 100 kcal.
NRF9.3 index — Fulgoni, Keast & Drewnowski, 2009. Computed from USDA nutrients.
Weight-loss friendliness (composite index)
Energy density 2.27 kcal/g · 7% calories from protein · 1.2 g fiber · 25.4 g sugar per 100 g.
Composite of energy density (Rolls et al., 1999), protein & fiber satiety, minus sugar. A calculated heuristic — ranks satiety-per-calorie, not a clinical measure.
Dietary load (calculated from USDA values)
Potential renal acid load. Positive = acid-forming, negative = alkaline-forming.
Sodium-to-potassium ratio: 0.37 (lower is better — aim for ≤ 1)
Sodium:potassium per WHO potassium guidance. Computed from USDA nutrients.