

Fish, eel, mixed species, cooked, dry heat
Whole food · Finfish and Shellfish Products

Photo: Wikipedia
Cooked eel is a rich, succulent seafood with a uniquely tender, almost melt-in-your-mouth texture and a subtly sweet, savory flavor. It's a protein-packed powerhouse, delivering over 23 grams of high-quality protein per 100 grams with zero carbohydrates. The significant fat content, nearly 15 grams per serving, contributes to its luxurious mouthfeel and carries fat-soluble vitamins.
Calorie split: 41% protein · 0% carbs · 59% fat
↓ Full nutrition💚 Why it's loved
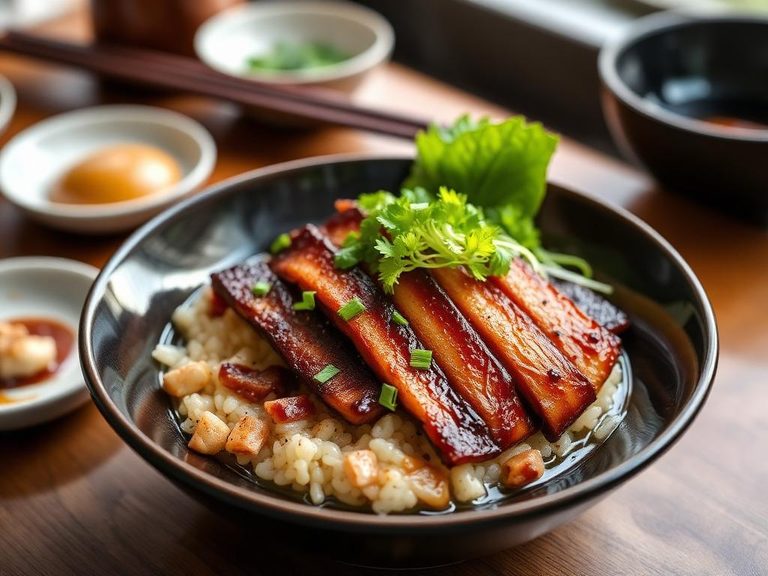
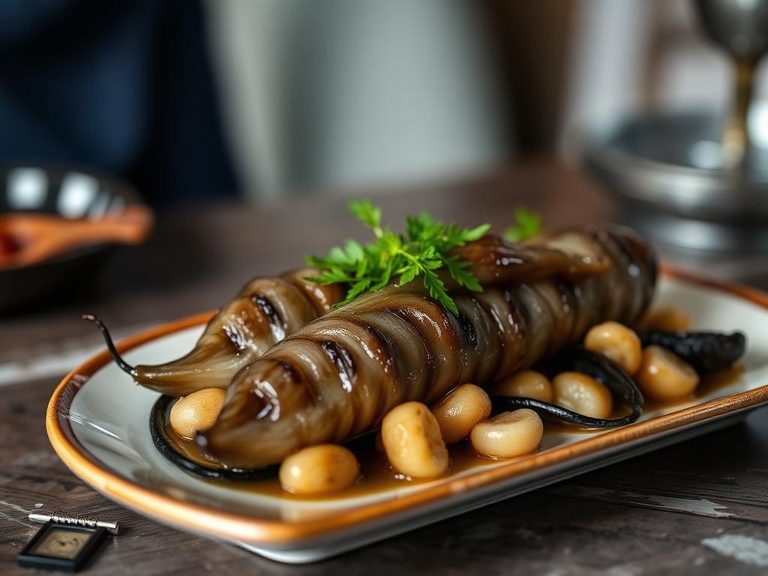
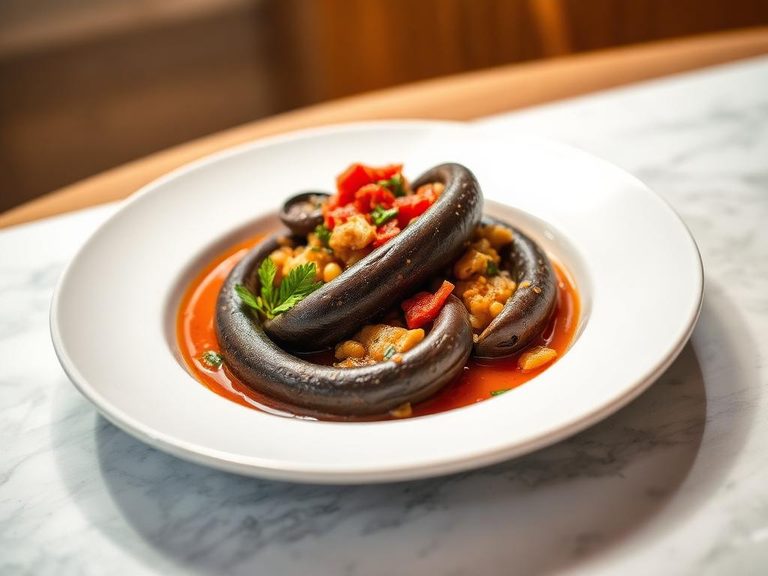
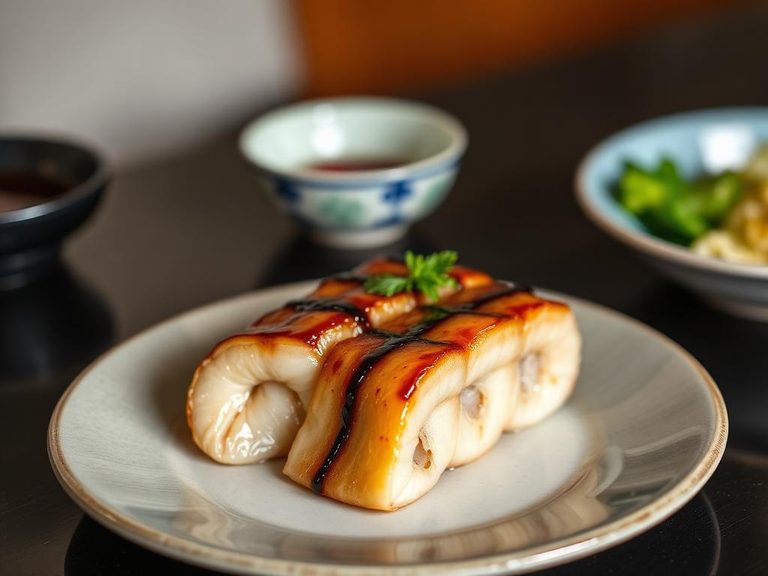
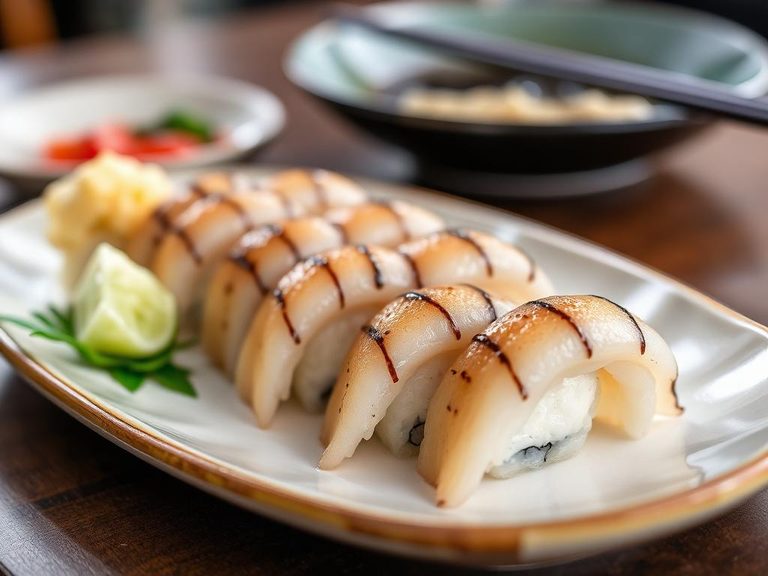
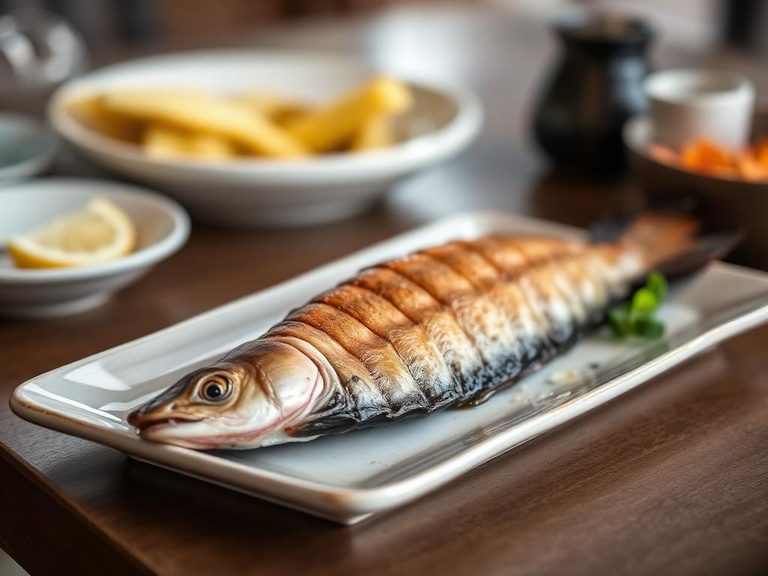
People adore eel for its delicate, sweet flavor that intensifies when grilled or glazed, and its uniquely smooth, fatty texture that feels indulgent. It's a culinary staple in many cultures, celebrated in dishes from Japanese unagi to European jellied eels.
⚠️ Watch-outs & how to enjoy it better
Eel is a common allergen, and some may find its slimy raw texture or gelatinous cooked form unappealing. Those monitoring cholesterol or saturated fat intake should be mindful of its high fat content. To enjoy it healthily, focus on grilling or broiling to render excess fat, and pair it with fiber-rich vegetables to balance the meal.
Key benefits
- Excellent source of complete, high-quality protein
- Rich in heart-healthy omega-3 fatty acids (EPA & DHA)
- Provides essential vitamins like B12, A, and D
- Contains important minerals such as selenium and phosphorus
- Zero carbohydrates, suitable for ketogenic and low-carb diets
🍽️ Popular dishes
🌍 Where it's eaten
💡 Did you know?
Most eels used for food are farmed in freshwater ponds, but they all begin life as tiny, transparent larvae called leptocephali that drift in the open ocean for years before migrating to rivers.
Full nutrition (USDA data · scales with serving)
| Water | 59.3 g |
| Energy | 236 kcal |
| Energy | 987 kj |
| Protein | 23.6 g |
| Total lipid (fat) | 14.9 g |
| Ash | 1.8 g |
| Carbohydrate, by difference | 0.00 g |
| Fiber, total dietary | 0.00 g |
| Calcium, Ca | 26.0 mg |
| Iron, Fe | 0.64 mg |
| Magnesium, Mg | 26.0 mg |
| Phosphorus, P | 277 mg |
| Potassium, K | 349 mg |
| Sodium, Na | 65.0 mg |
| Zinc, Zn | 2.1 mg |
| Copper, Cu | 0.03 mg |
| Manganese, Mn | 0.04 mg |
| Selenium, Se | 8.3 ug |
| Vitamin C, total ascorbic acid | 1.8 mg |
| Thiamin | 0.18 mg |
| Riboflavin | 0.05 mg |
| Niacin | 4.5 mg |
| Pantothenic acid | 0.28 mg |
| Vitamin B-6 | 0.08 mg |
| Folate, total | 17.0 ug |
| Folic acid | 0.00 ug |
| Folate, food | 17.0 ug |
| Folate, DFE | 17.0 ug |
| Vitamin B-12 | 2.9 ug |
| Vitamin A, RAE | 1137 ug |
| Retinol | 1137 ug |
| Vitamin A, IU | 3787 iu |
| Alcohol, ethyl | 0.00 g |
Fat & fatty acid profile (per 100g)
| Fatty acids, total saturated | 3.0 g |
| SFA 4:0 | 0.00 g |
| SFA 6:0 | 0.00 g |
| SFA 8:0 | 0.00 g |
| SFA 10:0 | 0.00 g |
| SFA 12:0 | 0.00 g |
| SFA 14:0 | 0.74 g |
| SFA 16:0 | 2.0 g |
| SFA 18:0 | 0.24 g |
| Fatty acids, total monounsaturated | 9.2 g |
| MUFA 16:1 | 1.6 g |
| MUFA 18:1 | 3.6 g |
| MUFA 20:1 | 3.8 g |
| MUFA 22:1 | 0.00 g |
| Fatty acids, total polyunsaturated | 1.2 g |
| PUFA 18:2 | 0.25 g |
| PUFA 18:3 | 0.55 g |
| PUFA 18:4 | 0.00 g |
| PUFA 20:4 | 0.12 g |
| PUFA 20:5 n-3 (EPA) | 0.11 g |
| PUFA 22:5 n-3 (DPA) | 0.10 g |
| PUFA 22:6 n-3 (DHA) | 0.08 g |
| Cholesterol | 161 mg |
Amino acid profile (per 100g)
| Tryptophan | 0.27 g |
| Threonine | 1.0 g |
| Isoleucine | 1.1 g |
| Leucine | 1.9 g |
| Lysine | 2.2 g |
| Methionine | 0.70 g |
| Cystine | 0.25 g |
| Phenylalanine | 0.92 g |
| Tyrosine | 0.80 g |
| Valine | 1.2 g |
| Arginine | 1.4 g |
| Histidine | 0.70 g |
| Alanine | 1.4 g |
| Aspartic acid | 2.4 g |
| Glutamic acid | 3.5 g |
| Glycine | 1.1 g |
| Proline | 0.84 g |
| Serine | 0.96 g |
FAQ
Is eel safe to eat raw?
Yes, in certain preparations like Japanese unagi (which is always cooked) or sashimi-grade freshwater eel (anago), but it must be sourced from a reputable supplier to ensure safety. Raw eel blood is toxic, so proper preparation is essential.
How is the nutritional profile of eel different from other fish?
Eel is notably higher in fat and calories than lean white fish like cod, but this fat is rich in omega-3s. It's also exceptionally high in vitamin B12, providing over 200% of the daily value in a 100g serving.
Why is eel sometimes so expensive?
The high cost is largely due to the difficulty of farming eels. They cannot yet be bred in captivity on a commercial scale; all farmed eel must be caught as wild juveniles (glass eels), whose populations are fragile and subject to strict quotas.
Nutrient density (calculated · NRF9.3)
Nutrient Rich Foods index: beneficial nutrients (protein, fiber, vitamins, minerals) minus saturated fat, added sugar & sodium, per 100 kcal.
NRF9.3 index — Fulgoni, Keast & Drewnowski, 2009. Computed from USDA nutrients.
Weight-loss friendliness (composite index)
Energy density 2.36 kcal/g · 40% calories from protein · 0.0 g fiber · 0.0 g sugar per 100 g.
Composite of energy density (Rolls et al., 1999), protein & fiber satiety, minus sugar. A calculated heuristic — ranks satiety-per-calorie, not a clinical measure.
Dietary load (calculated from USDA values)
Potential renal acid load. Positive = acid-forming, negative = alkaline-forming.
Sodium-to-potassium ratio: 0.19 (lower is better — aim for ≤ 1)
Sodium:potassium per WHO potassium guidance. Computed from USDA nutrients.