

Pie, cherry, prepared from recipe
Whole food · Baked Products

Photo: Wikipedia
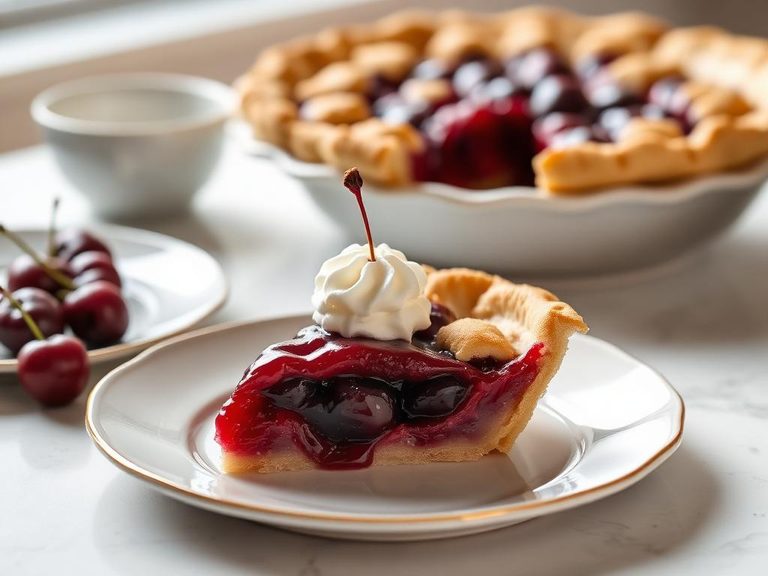
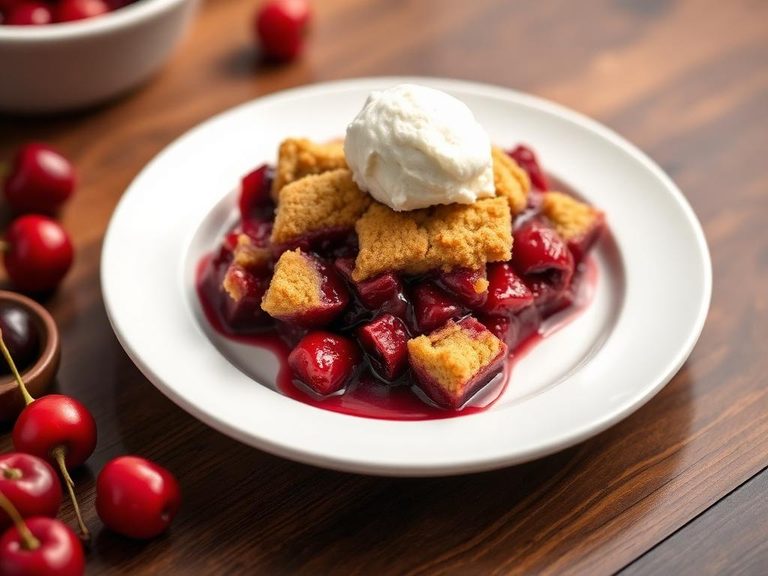
A classic dessert featuring a flaky, buttery pastry crust encasing a sweet-tart cherry filling, often made with sour or sweet cherries. The filling is typically thickened with cornstarch or flour, creating a jammy, glossy texture that contrasts with the crisp crust. Per 100g, it provides 270 kcal with a notable 38.5g of carbohydrates, primarily from the fruit and added sugars.
Calorie split: 4% protein · 56% carbs · 40% fat
↓ Full nutrition💚 Why it's loved
People love cherry pie for its perfect balance of sweet and tart flavors, with the juicy, ruby-red filling contrasting the buttery, flaky crust. It's deeply embedded in cultural traditions, especially in American cuisine, often associated with summer, holidays, and home baking.
⚠️ Watch-outs & how to enjoy it better
The high carbohydrate content (38.5g per 100g) can cause blood-sugar spikes, making it less suitable for those managing diabetes or insulin resistance. To counteract this, pair a small slice with a source of protein or fat (like a dollop of Greek yogurt or a handful of nuts) to slow digestion and moderate the glycemic response.
Key benefits
- Provides a quick source of energy from carbohydrates
- Contains small amounts of protein from the crust and fruit
- Offers a comforting, nostalgic flavor profile
- Can be a centerpiece for social gatherings and celebrations
🍽️ Popular dishes
🌍 Where it's eaten
💡 Did you know?
The tradition of cherry pie in America is so strong that it's often called 'as American as cherry pie,' though the phrase 'as American as apple pie' is more common. The first recorded cherry pie recipe in the U.S. appeared in a 1796 cookbook.
Full nutrition (USDA data · scales with serving)
| Water | 45.8 g |
| Energy | 270 kcal |
| Energy | 1130 kj |
| Protein | 2.8 g |
| Total lipid (fat) | 12.2 g |
| Ash | 0.70 g |
| Carbohydrate, by difference | 38.5 g |
| Calcium, Ca | 10.0 mg |
| Iron, Fe | 1.9 mg |
| Magnesium, Mg | 9.0 mg |
| Phosphorus, P | 30.0 mg |
| Potassium, K | 77.0 mg |
| Sodium, Na | 191 mg |
| Zinc, Zn | 0.20 mg |
| Copper, Cu | 0.08 mg |
| Manganese, Mn | 0.20 mg |
| Selenium, Se | 7.8 ug |
| Vitamin C, total ascorbic acid | 1.0 mg |
| Thiamin | 0.15 mg |
| Riboflavin | 0.13 mg |
| Niacin | 1.3 mg |
| Pantothenic acid | 0.12 mg |
| Vitamin B-6 | 0.03 mg |
| Folate, total | 27.0 ug |
| Folic acid | 20.0 ug |
| Folate, food | 7.0 ug |
| Folate, DFE | 41.0 ug |
| Vitamin B-12 | 0.00 ug |
| Vitamin A, RAE | 29.0 ug |
| Retinol | 9.0 ug |
| Vitamin A, IU | 409 iu |
Fat & fatty acid profile (per 100g)
| Fatty acids, total saturated | 3.0 g |
| SFA 4:0 | 0.00 g |
| SFA 6:0 | 0.00 g |
| SFA 8:0 | 0.00 g |
| SFA 10:0 | 0.00 g |
| SFA 12:0 | 0.00 g |
| SFA 14:0 | 0.05 g |
| SFA 16:0 | 1.7 g |
| SFA 18:0 | 1.2 g |
| Fatty acids, total monounsaturated | 5.3 g |
| MUFA 16:1 | 0.00 g |
| MUFA 18:1 | 5.3 g |
| MUFA 20:1 | 0.00 g |
| MUFA 22:1 | 0.00 g |
| Fatty acids, total polyunsaturated | 3.2 g |
| PUFA 18:2 | 3.0 g |
| PUFA 18:3 | 0.20 g |
| PUFA 18:4 | 0.00 g |
| PUFA 20:4 | 0.00 g |
| PUFA 20:5 n-3 (EPA) | 0.00 g |
| PUFA 22:5 n-3 (DPA) | 0.00 g |
| PUFA 22:6 n-3 (DHA) | 0.00 g |
| Cholesterol | 0.00 mg |
Amino acid profile (per 100g)
| Tryptophan | 0.03 g |
| Threonine | 0.07 g |
| Isoleucine | 0.09 g |
| Leucine | 0.17 g |
| Lysine | 0.07 g |
| Methionine | 0.04 g |
| Cystine | 0.05 g |
| Phenylalanine | 0.12 g |
| Tyrosine | 0.07 g |
| Valine | 0.10 g |
| Arginine | 0.10 g |
| Histidine | 0.06 g |
| Alanine | 0.09 g |
| Aspartic acid | 0.34 g |
| Glutamic acid | 0.79 g |
| Glycine | 0.09 g |
| Proline | 0.28 g |
| Serine | 0.13 g |
FAQ
Is cherry pie high in sugar?
Yes, cherry pie is typically high in added sugars, with the filling and crust contributing to its sweetness. The 0g sugar listed per 100g in the data likely refers to unsweetened cherries, not the prepared pie, which would contain significant sugar from the recipe.
Can I make cherry pie healthier?
You can reduce sugar by using less sweetener in the filling, opting for whole-grain flour in the crust, and using fresh or frozen cherries instead of canned. Adding a small amount of almond flour to the crust can also boost protein and fiber.
Is cherry pie a good source of fiber?
No, cherry pie is typically low in fiber (0g per 100g in the data), as the crust is made from refined flour and the filling is often strained or cooked down. To increase fiber, you could add chia seeds or oats to the crust or filling.
Nutrient density (calculated · NRF9.3)
Nutrient Rich Foods index: beneficial nutrients (protein, fiber, vitamins, minerals) minus saturated fat, added sugar & sodium, per 100 kcal.
NRF9.3 index — Fulgoni, Keast & Drewnowski, 2009. Computed from USDA nutrients.
Weight-loss friendliness (composite index)
Energy density 2.70 kcal/g · 4% calories from protein · 0.0 g fiber · 0.0 g sugar per 100 g.
Composite of energy density (Rolls et al., 1999), protein & fiber satiety, minus sugar. A calculated heuristic — ranks satiety-per-calorie, not a clinical measure.
Dietary load (calculated from USDA values)
Potential renal acid load. Positive = acid-forming, negative = alkaline-forming.
Sodium-to-potassium ratio: 2.48 (lower is better — aim for ≤ 1)
Sodium:potassium per WHO potassium guidance. Computed from USDA nutrients.