

Fish, salmon, chinook, cooked, dry heat
Whole food · Finfish and Shellfish Products

Photo: Wikipedia
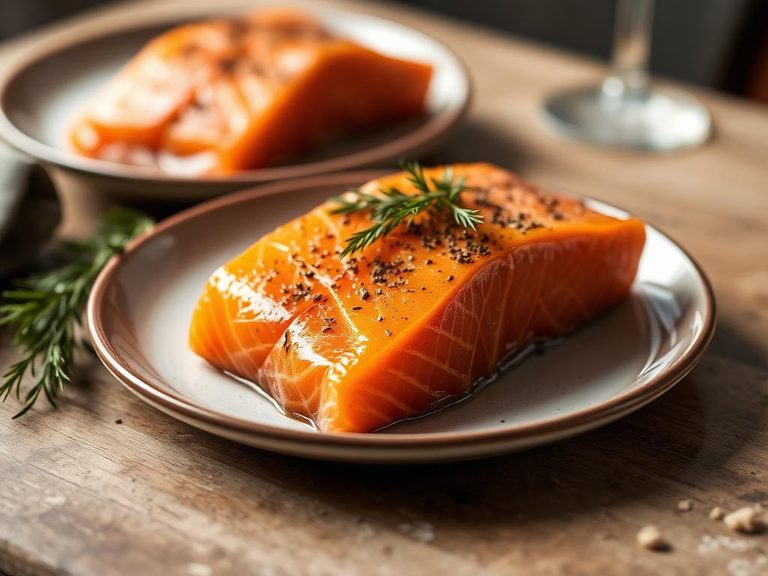
Chinook salmon, also known as King salmon, is the largest and most prized of the Pacific salmon species. When cooked with dry heat, its flesh becomes a rich, deep orange-red with a buttery, luxurious texture and a robust, clean flavor. It's a nutritional powerhouse, delivering a massive 25.72 grams of high-quality protein and a substantial 13.38 grams of healthy fats per 100-gram serving, with zero carbohydrates.
Calorie split: 46% protein · 0% carbs · 54% fat
↓ Full nutrition💚 Why it's loved
People adore Chinook salmon for its exceptionally high fat content, which creates a melt-in-your-mouth, buttery richness that other salmon varieties often lack. Its robust flavor stands up beautifully to grilling, roasting, or smoking, making it a versatile centerpiece for both simple weeknight meals and celebratory feasts.
⚠️ Watch-outs & how to enjoy it better
The primary caution is its high fat and calorie density compared to leaner fish, which requires mindful portion control for those managing calorie intake. As an oily fish, it can accumulate environmental contaminants like mercury; choosing wild-caught from sustainable sources and varying your seafood intake mitigates this. Its strong flavor can also be overpowering if overcooked.
Key benefits
- Excellent source of complete, high-quality protein for muscle maintenance.
- Rich in omega-3 fatty acids (EPA and DHA) for heart and brain health.
- Provides a significant dose of vitamin D and B12.
- Naturally free of carbohydrates and sugars.
- Contains astaxanthin, a potent antioxidant that gives it its color.
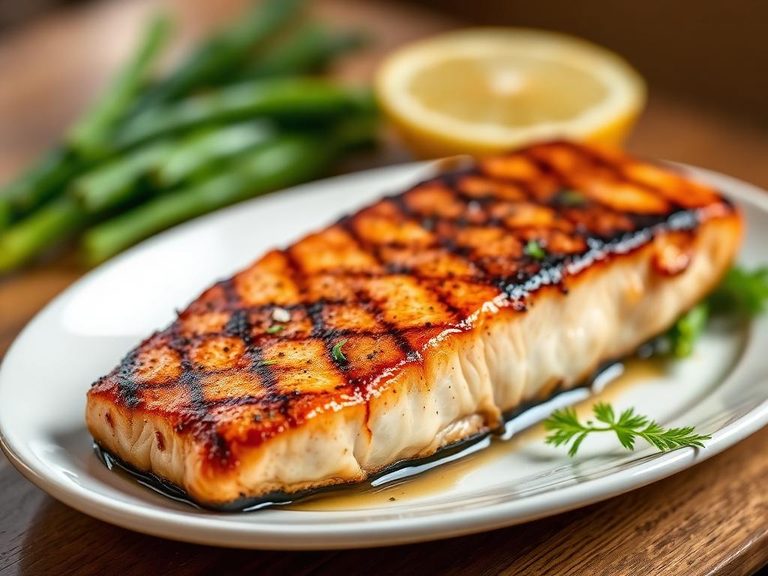
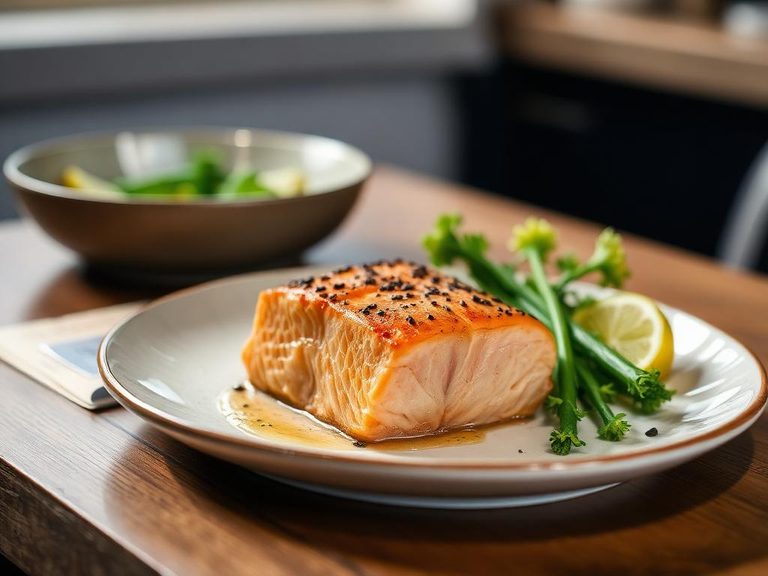
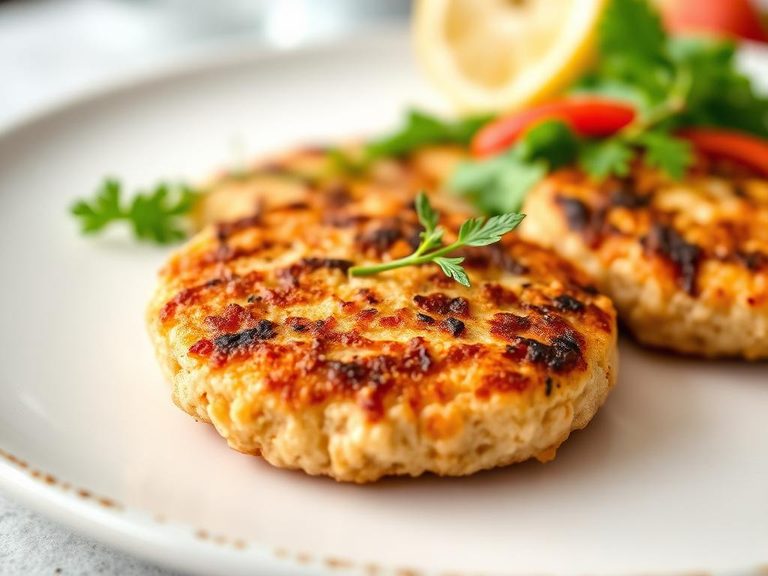
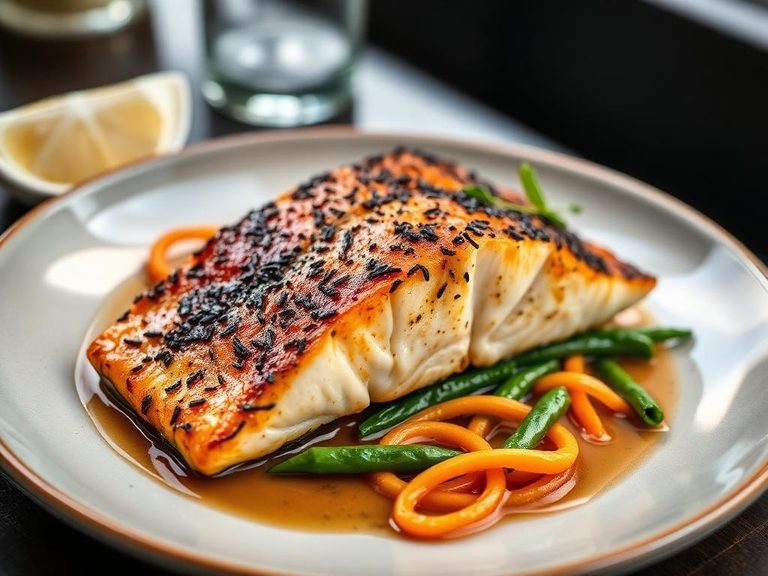
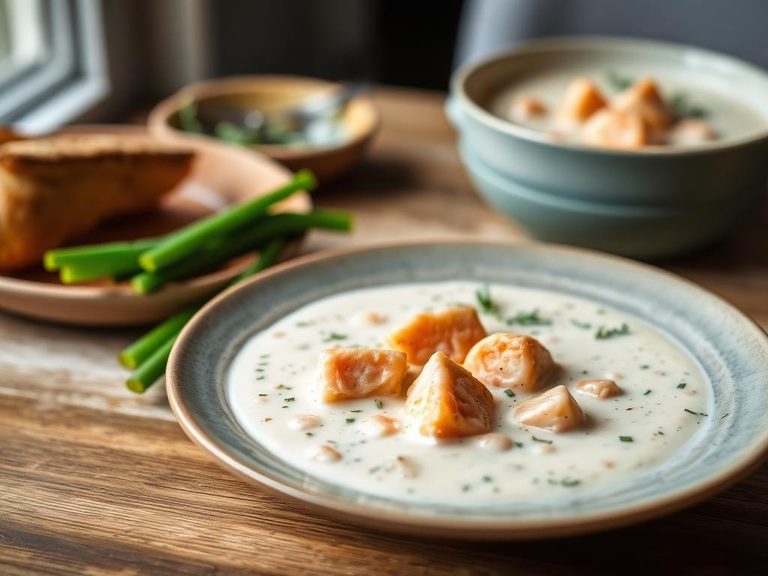
🍽️ Popular dishes
🌍 Where it's eaten
💡 Did you know?
Chinook salmon are the only Pacific salmon species that can spawn multiple times in their lifetime, though most die after their first spawning run.
Full nutrition (USDA data · scales with serving)
| Water | 65.6 g |
| Energy | 231 kcal |
| Energy | 967 kj |
| Protein | 25.7 g |
| Total lipid (fat) | 13.4 g |
| Ash | 1.8 g |
| Carbohydrate, by difference | 0.00 g |
| Fiber, total dietary | 0.00 g |
| Calcium, Ca | 28.0 mg |
| Iron, Fe | 0.91 mg |
| Magnesium, Mg | 122 mg |
| Phosphorus, P | 371 mg |
| Potassium, K | 505 mg |
| Sodium, Na | 60.0 mg |
| Zinc, Zn | 0.56 mg |
| Copper, Cu | 0.05 mg |
| Manganese, Mn | 0.02 mg |
| Selenium, Se | 46.8 ug |
| Vitamin C, total ascorbic acid | 4.1 mg |
| Thiamin | 0.04 mg |
| Riboflavin | 0.15 mg |
| Niacin | 10.0 mg |
| Pantothenic acid | 0.86 mg |
| Vitamin B-6 | 0.46 mg |
| Folate, total | 35.0 ug |
| Folic acid | 0.00 ug |
| Folate, food | 35.0 ug |
| Folate, DFE | 35.0 ug |
| Vitamin B-12 | 2.9 ug |
| Vitamin A, RAE | 149 ug |
| Retinol | 149 ug |
| Vitamin A, IU | 496 iu |
Fat & fatty acid profile (per 100g)
| Fatty acids, total saturated | 3.2 g |
| SFA 14:0 | 0.46 g |
| SFA 16:0 | 2.0 g |
| SFA 18:0 | 0.71 g |
| Fatty acids, total monounsaturated | 5.7 g |
| MUFA 16:1 | 1.1 g |
| MUFA 18:1 | 3.6 g |
| MUFA 20:1 | 0.58 g |
| MUFA 22:1 | 0.44 g |
| Fatty acids, total polyunsaturated | 2.7 g |
| PUFA 18:2 | 0.14 g |
| PUFA 18:3 | 0.11 g |
| PUFA 18:4 | 0.18 g |
| PUFA 20:4 | 0.20 g |
| PUFA 20:5 n-3 (EPA) | 1.0 g |
| PUFA 22:5 n-3 (DPA) | 0.30 g |
| PUFA 22:6 n-3 (DHA) | 0.73 g |
| Cholesterol | 85.0 mg |
Amino acid profile (per 100g)
| Tryptophan | 0.29 g |
| Threonine | 1.1 g |
| Isoleucine | 1.2 g |
| Leucine | 2.1 g |
| Lysine | 2.4 g |
| Methionine | 0.76 g |
| Cystine | 0.28 g |
| Phenylalanine | 1.0 g |
| Tyrosine | 0.87 g |
| Valine | 1.3 g |
| Arginine | 1.5 g |
| Histidine | 0.76 g |
| Alanine | 1.6 g |
| Aspartic acid | 2.6 g |
| Glutamic acid | 3.8 g |
| Glycine | 1.2 g |
| Proline | 0.91 g |
| Serine | 1.0 g |
FAQ
How is Chinook salmon different from Sockeye or Atlantic salmon?
Chinook (King) is the largest, fattiest, and most flavorful, with a buttery texture. Sockeye is leaner with a deeper red color and a more pronounced, 'fishier' taste. Farmed Atlantic salmon is widely available, milder in flavor, and has a higher fat content than Sockeye but typically less than wild Chinook.
What's the best way to cook it to preserve its texture?
Dry-heat methods like grilling, broiling, or pan-searing are ideal. Cook it quickly over high heat to get a crispy skin while keeping the interior moist and just opaque. Avoid overcooking, as its high fat content can dry out if left on heat too long.
Is it safe to eat raw, like in sushi?
While fresh, high-quality, sashimi-grade Chinook is used in some high-end sushi preparations, it must be previously frozen to specific temperatures to eliminate parasites. For home consumption, cooking is the recommended safe practice.
Nutrient density (calculated · NRF9.3)
Nutrient Rich Foods index: beneficial nutrients (protein, fiber, vitamins, minerals) minus saturated fat, added sugar & sodium, per 100 kcal.
NRF9.3 index — Fulgoni, Keast & Drewnowski, 2009. Computed from USDA nutrients.
Weight-loss friendliness (composite index)
Energy density 2.31 kcal/g · 45% calories from protein · 0.0 g fiber · 0.0 g sugar per 100 g.
Composite of energy density (Rolls et al., 1999), protein & fiber satiety, minus sugar. A calculated heuristic — ranks satiety-per-calorie, not a clinical measure.
Dietary load (calculated from USDA values)
Potential renal acid load. Positive = acid-forming, negative = alkaline-forming.
Sodium-to-potassium ratio: 0.12 (lower is better — aim for ≤ 1)
Sodium:potassium per WHO potassium guidance. Computed from USDA nutrients.