

Pie, apple, prepared from recipe
Whole food · Baked Products

Photo: Wikipedia
A classic baked dessert featuring a flaky, buttery crust enveloping tender, spiced apple slices. The filling is sweet and aromatic, often with a hint of cinnamon, while the crust provides a satisfying, crisp contrast. Nutritionally, it's a calorie-dense treat, delivering a significant amount of carbohydrates and fat per serving.
Calorie split: 4% protein · 55% carbs · 42% fat
↓ Full nutrition💚 Why it's loved
People adore apple pie for its comforting, nostalgic flavor profile that perfectly balances sweet, tart, and spiced notes. It's a versatile centerpiece for gatherings, from holiday feasts to casual summer picnics, and is deeply embedded in cultural traditions, especially in North America.
⚠️ Watch-outs & how to enjoy it better
The high carbohydrate and fat content can cause blood-sugar spikes and is not ideal for strict low-carb diets. The refined flour crust is a common gluten allergen. To mitigate, enjoy a modest slice paired with a source of protein or fat (like a scoop of plain Greek yogurt or a handful of nuts) to slow sugar absorption, and consider a recipe using whole-wheat flour or an almond-flour crust for added fiber.
Key benefits
- Provides quick energy from carbohydrates
- Contains small amounts of essential minerals like potassium
- A traditional comfort food with cultural significance
- Can be made with fresh, whole fruit as a primary ingredient
- Versatile for both sweet and savory variations
🍽️ Popular dishes
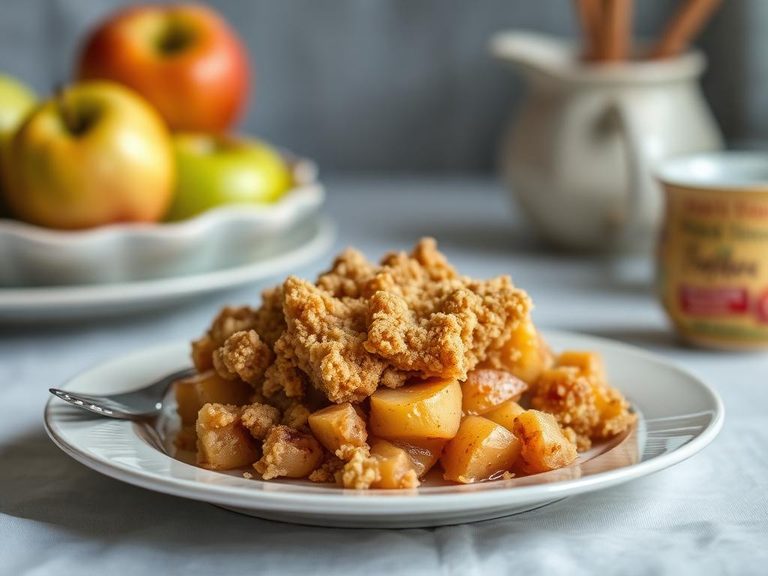

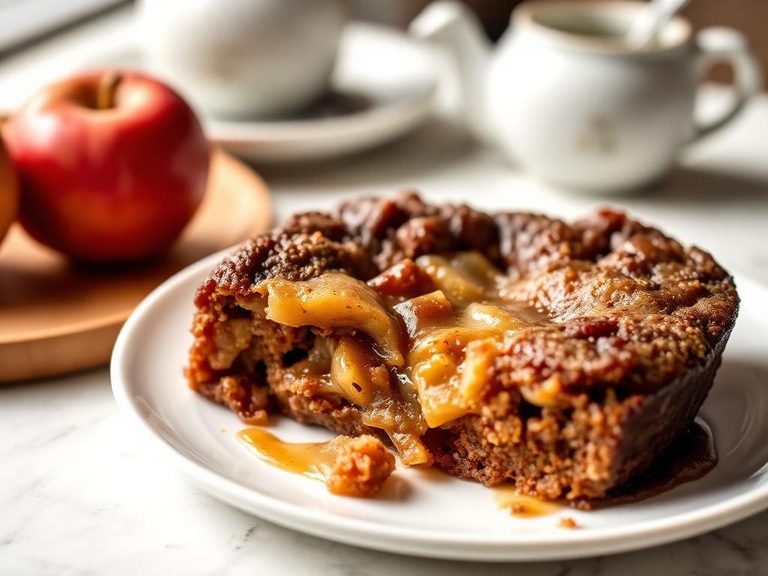


🌍 Where it's eaten
💡 Did you know?
The phrase 'as American as apple pie' became a popular idiom during World War II, when soldiers reportedly said they were fighting to protect 'mom and apple pie.'
Full nutrition (USDA data · scales with serving)
| Water | 47.3 g |
| Energy | 265 kcal |
| Energy | 1109 kj |
| Protein | 2.4 g |
| Total lipid (fat) | 12.5 g |
| Ash | 0.80 g |
| Carbohydrate, by difference | 37.1 g |
| Calcium, Ca | 7.0 mg |
| Iron, Fe | 1.1 mg |
| Magnesium, Mg | 7.0 mg |
| Phosphorus, P | 28.0 mg |
| Potassium, K | 79.0 mg |
| Sodium, Na | 211 mg |
| Zinc, Zn | 0.19 mg |
| Copper, Cu | 0.05 mg |
| Manganese, Mn | 0.18 mg |
| Selenium, Se | 7.8 ug |
| Vitamin C, total ascorbic acid | 1.7 mg |
| Thiamin | 0.15 mg |
| Riboflavin | 0.11 mg |
| Niacin | 1.2 mg |
| Pantothenic acid | 0.09 mg |
| Vitamin B-6 | 0.03 mg |
| Folate, total | 24.0 ug |
| Folic acid | 20.0 ug |
| Folate, food | 4.0 ug |
| Folate, DFE | 38.0 ug |
| Vitamin B-12 | 0.00 ug |
| Vitamin A, RAE | 11.0 ug |
| Retinol | 9.0 ug |
| Vitamin A, IU | 58.0 iu |
Fat & fatty acid profile (per 100g)
| Fatty acids, total saturated | 3.0 g |
| SFA 4:0 | 0.00 g |
| SFA 6:0 | 0.00 g |
| SFA 8:0 | 0.00 g |
| SFA 10:0 | 0.00 g |
| SFA 12:0 | 0.00 g |
| SFA 14:0 | 0.06 g |
| SFA 16:0 | 1.7 g |
| SFA 18:0 | 1.3 g |
| Fatty acids, total monounsaturated | 5.4 g |
| MUFA 16:1 | 0.00 g |
| MUFA 18:1 | 5.4 g |
| MUFA 20:1 | 0.00 g |
| MUFA 22:1 | 0.00 g |
| Fatty acids, total polyunsaturated | 3.3 g |
| PUFA 18:2 | 3.1 g |
| PUFA 18:3 | 0.20 g |
| PUFA 18:4 | 0.00 g |
| PUFA 20:4 | 0.00 g |
| PUFA 20:5 n-3 (EPA) | 0.00 g |
| PUFA 22:5 n-3 (DPA) | 0.00 g |
| PUFA 22:6 n-3 (DHA) | 0.00 g |
| Cholesterol | 0.00 mg |
Amino acid profile (per 100g)
| Tryptophan | 0.03 g |
| Threonine | 0.07 g |
| Isoleucine | 0.08 g |
| Leucine | 0.16 g |
| Lysine | 0.06 g |
| Methionine | 0.04 g |
| Cystine | 0.05 g |
| Phenylalanine | 0.12 g |
| Tyrosine | 0.07 g |
| Valine | 0.10 g |
| Arginine | 0.10 g |
| Histidine | 0.05 g |
| Alanine | 0.08 g |
| Aspartic acid | 0.11 g |
| Glutamic acid | 0.79 g |
| Glycine | 0.09 g |
| Proline | 0.27 g |
| Serine | 0.12 g |
FAQ
Is apple pie a good source of fiber?
Not particularly. The data shows 0g of fiber per 100g, likely because the apples are cooked and the crust is made with refined flour. Using whole-wheat flour in the crust and leaving apple skins on can increase fiber content.
Why is there 0g of sugar listed if it tastes sweet?
The 'sugar' line in this data likely refers to *added* sugars. The sweetness comes from the natural fructose in the apples and any sugar added to the filling during cooking, which is included in the total carbohydrate count.
Can I make a healthier version at home?
Absolutely. You can reduce added sugar, use a whole-grain or oat-based crust, incorporate more apples than dough, and add spices like cinnamon and nutmeg for flavor without calories.
Nutrient density (calculated · NRF9.3)
Nutrient Rich Foods index: beneficial nutrients (protein, fiber, vitamins, minerals) minus saturated fat, added sugar & sodium, per 100 kcal.
NRF9.3 index — Fulgoni, Keast & Drewnowski, 2009. Computed from USDA nutrients.
Weight-loss friendliness (composite index)
Energy density 2.65 kcal/g · 4% calories from protein · 0.0 g fiber · 0.0 g sugar per 100 g.
Composite of energy density (Rolls et al., 1999), protein & fiber satiety, minus sugar. A calculated heuristic — ranks satiety-per-calorie, not a clinical measure.
Dietary load (calculated from USDA values)
Potential renal acid load. Positive = acid-forming, negative = alkaline-forming.
Sodium-to-potassium ratio: 2.67 (lower is better — aim for ≤ 1)
Sodium:potassium per WHO potassium guidance. Computed from USDA nutrients.