

Chicken, broilers or fryers, back, meat and skin, cooked, fried, batter
Whole food · Poultry Products

Photo: Wikipedia
This is a piece of chicken back—the bony, flavorful section connecting the wings to the thighs—that has been coated in a seasoned batter and deep-fried until golden and crispy. The result is a textural delight: a crunchy, savory shell giving way to tender, juicy meat clinging to the bone, rich with rendered skin fat. Nutritionally, it's a dense source of protein and fat, delivering a substantial 331 calories per 100g, with virtually no carbohydrates beyond the batter.
Calorie split: 27% protein · 13% carbs · 60% fat
↓ Full nutrition💚 Why it's loved
People love it for its unbeatable crunch and deep, savory flavor that comes from the combination of seasoned batter, rendered skin, and juicy meat. It's a beloved comfort food and a staple in casual dining, often enjoyed as a shareable appetizer or a hearty main course.
⚠️ Watch-outs & how to enjoy it better
The primary downside is its high calorie and fat density, which can contribute to excess calorie intake if not portion-controlled. The frying process also creates advanced glycation end products (AGEs) and may use oils high in omega-6 fats. To counteract this, enjoy it in moderation, pair it with a large, fiber-rich salad or steamed vegetables to increase fullness and nutrient intake, and consider baking or air-frying a similar cut at home to reduce oil absorption.
Key benefits
- High-quality protein for muscle maintenance and satiety.
- Rich in dietary fats, including monounsaturated fats from the chicken skin.
- Excellent source of minerals like phosphorus and selenium from the bone-in meat.
- Provides B vitamins, particularly niacin (B3) and B6, for energy metabolism.
- The bone-in cut offers collagen and gelatin when simmered, beneficial for gut health.
🍽️ Popular dishes

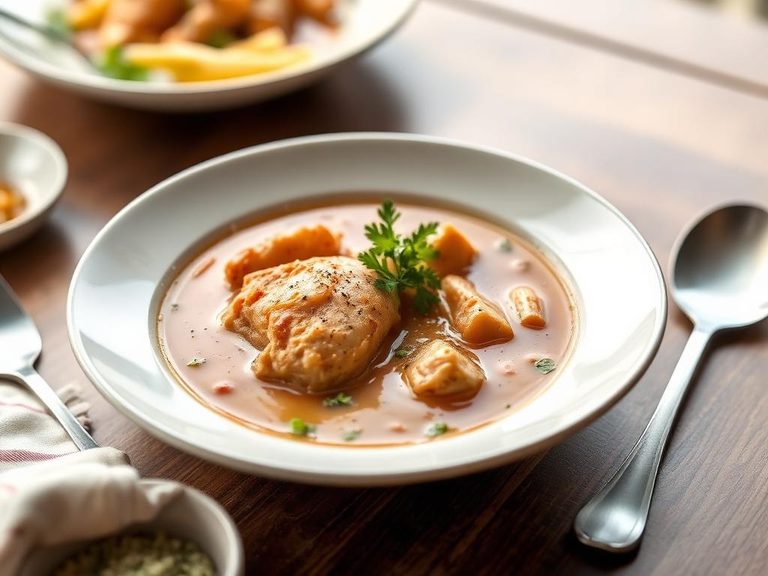
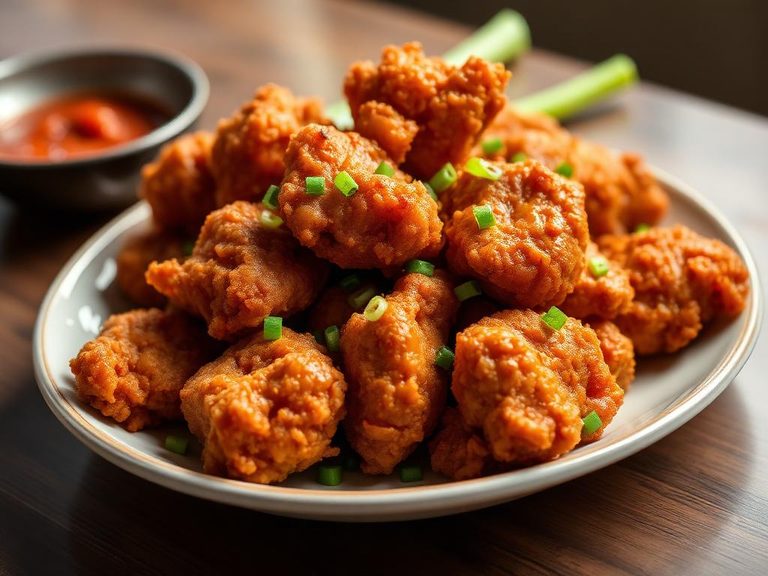
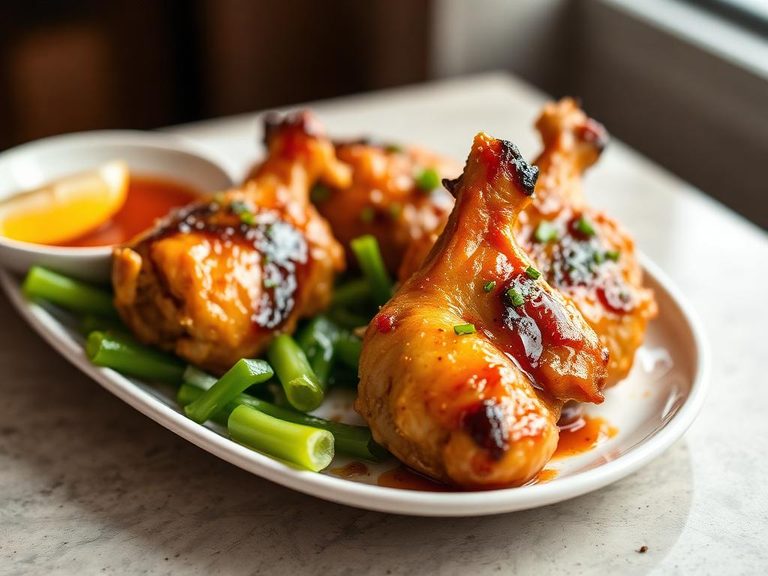
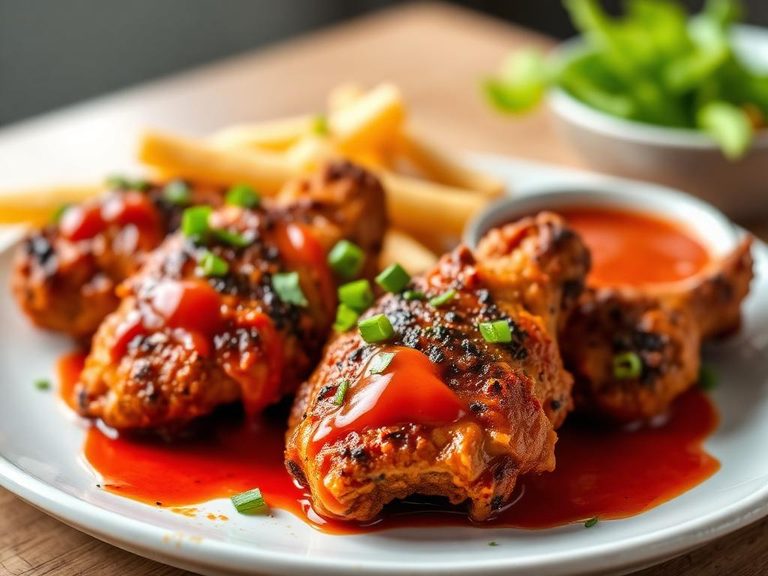
🌍 Where it's eaten
💡 Did you know?
The chicken back is considered the most flavorful part of the bird for making stock because the high ratio of bone, connective tissue, and skin releases immense collagen and flavor during simmering.
Full nutrition (USDA data · scales with serving)
| Water | 44.5 g |
| Energy | 331 kcal |
| Energy | 1385 kj |
| Protein | 22.0 g |
| Total lipid (fat) | 21.9 g |
| Ash | 1.4 g |
| Carbohydrate, by difference | 10.3 g |
| Calcium, Ca | 26.0 mg |
| Iron, Fe | 1.5 mg |
| Magnesium, Mg | 19.0 mg |
| Phosphorus, P | 137 mg |
| Potassium, K | 180 mg |
| Sodium, Na | 317 mg |
| Zinc, Zn | 2.0 mg |
| Copper, Cu | 0.08 mg |
| Manganese, Mn | 0.06 mg |
| Selenium, Se | 29.0 ug |
| Vitamin C, total ascorbic acid | 0.00 mg |
| Thiamin | 0.12 mg |
| Riboflavin | 0.21 mg |
| Niacin | 5.8 mg |
| Pantothenic acid | 0.90 mg |
| Vitamin B-6 | 0.23 mg |
| Folate, total | 20.0 ug |
| Folic acid | 11.0 ug |
| Folate, food | 9.0 ug |
| Folate, DFE | 28.0 ug |
| Vitamin B-12 | 0.26 ug |
| Vitamin A, RAE | 36.0 ug |
| Retinol | 36.0 ug |
| Vitamin A, IU | 119 iu |
Fat & fatty acid profile (per 100g)
| Fatty acids, total saturated | 5.8 g |
| SFA 10:0 | 0.00 g |
| SFA 12:0 | 0.03 g |
| SFA 14:0 | 0.13 g |
| SFA 16:0 | 3.9 g |
| SFA 18:0 | 1.7 g |
| Fatty acids, total monounsaturated | 8.9 g |
| MUFA 16:1 | 0.71 g |
| MUFA 18:1 | 8.0 g |
| MUFA 20:1 | 0.11 g |
| MUFA 22:1 | 0.00 g |
| Fatty acids, total polyunsaturated | 5.2 g |
| PUFA 18:2 | 4.7 g |
| PUFA 18:3 | 0.25 g |
| PUFA 20:4 | 0.13 g |
| PUFA 20:5 n-3 (EPA) | 0.02 g |
| PUFA 22:5 n-3 (DPA) | 0.03 g |
| PUFA 22:6 n-3 (DHA) | 0.05 g |
| Cholesterol | 88.0 mg |
Amino acid profile (per 100g)
| Tryptophan | 0.25 g |
| Threonine | 0.90 g |
| Isoleucine | 1.1 g |
| Leucine | 1.6 g |
| Lysine | 1.7 g |
| Methionine | 0.57 g |
| Cystine | 0.31 g |
| Phenylalanine | 0.88 g |
| Tyrosine | 0.71 g |
| Valine | 1.1 g |
| Arginine | 1.3 g |
| Histidine | 0.64 g |
| Alanine | 1.2 g |
| Aspartic acid | 1.9 g |
| Glutamic acid | 3.5 g |
| Glycine | 1.4 g |
| Proline | 1.2 g |
| Serine | 0.82 g |
FAQ
Is chicken back meat healthy to eat?
It can be part of a healthy diet in moderation. It's a good source of protein and nutrients, but its high fat and calorie content from frying means it's best enjoyed occasionally rather than as a daily staple.
How is chicken back different from chicken thigh?
The back is bony with less meat, primarily prized for its flavor in stocks and broths. The thigh is a meatier, bone-in cut with more substantial flesh, making it more suitable as a main protein portion.
Can I use chicken backs to make broth?
Absolutely. Chicken backs are ideal for making a rich, gelatinous bone broth. Their high collagen content yields a broth with excellent body and flavor, perfect for soups and sauces.
Nutrient density (calculated · NRF9.3)
Nutrient Rich Foods index: beneficial nutrients (protein, fiber, vitamins, minerals) minus saturated fat, added sugar & sodium, per 100 kcal.
NRF9.3 index — Fulgoni, Keast & Drewnowski, 2009. Computed from USDA nutrients.
Weight-loss friendliness (composite index)
Energy density 3.31 kcal/g · 27% calories from protein · 0.0 g fiber · 0.0 g sugar per 100 g.
Composite of energy density (Rolls et al., 1999), protein & fiber satiety, minus sugar. A calculated heuristic — ranks satiety-per-calorie, not a clinical measure.
Dietary load (calculated from USDA values)
Potential renal acid load. Positive = acid-forming, negative = alkaline-forming.
Sodium-to-potassium ratio: 1.76 (lower is better — aim for ≤ 1)
Sodium:potassium per WHO potassium guidance. Computed from USDA nutrients.