

Lasagna with meat & sauce, low-fat, frozen entree
Whole food · Meals, Entrees, and Side Dishes

Photo: Wikipedia
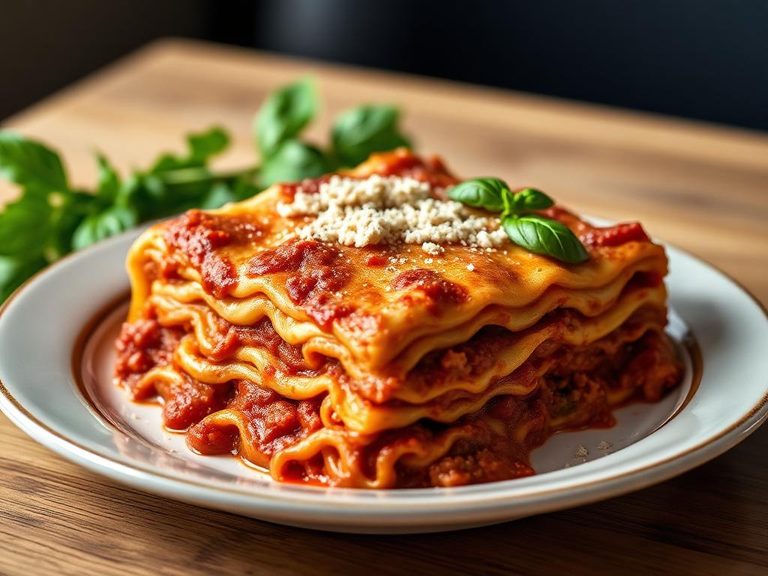
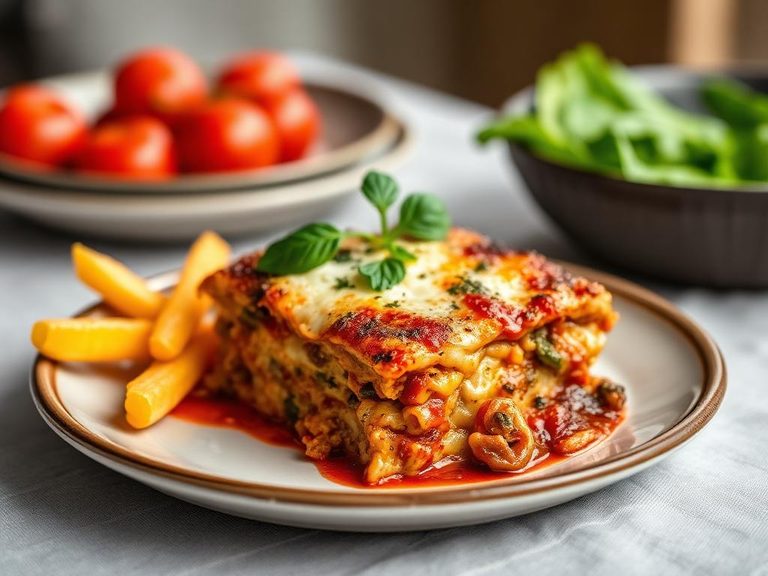
This is a lean, frozen take on the classic Italian-American comfort dish, featuring layers of pasta, meat sauce, and cheese in a portion-controlled, low-fat format. The texture is typically soft and cohesive after microwaving, with a savory, tomato-forward flavor profile. At just 101 kcal per 100g, it delivers a satisfying meal with a notable protein boost for a frozen entree.
Calorie split: 27% protein · 53% carbs · 20% fat
↓ Full nutrition💚 Why it's loved
People love it for delivering the nostalgic, savory, and hearty flavors of homemade lasagna in a convenient, calorie-conscious format. It offers a comforting, familiar taste without the extensive preparation time of a traditional recipe.
⚠️ Watch-outs & how to enjoy it better
The low-fat formulation can sometimes result in a less rich, slightly drier texture compared to full-fat versions. Frozen entrees are often high in sodium to enhance flavor and preserve the dish, which is a consideration for those monitoring salt intake. To counteract, pair with a fresh, low-sodium side salad with a vinegar-based dressing to add volume and freshness. Always check the label and consider splitting the portion if sodium is a concern.
Key benefits
- High protein-to-calorie ratio for a prepared meal
- Low fat content, especially saturated fat
- Convenient, portion-controlled source of complex carbs
- Provides dietary fiber from tomato sauce and pasta
- Quick, hot meal solution with minimal preparation
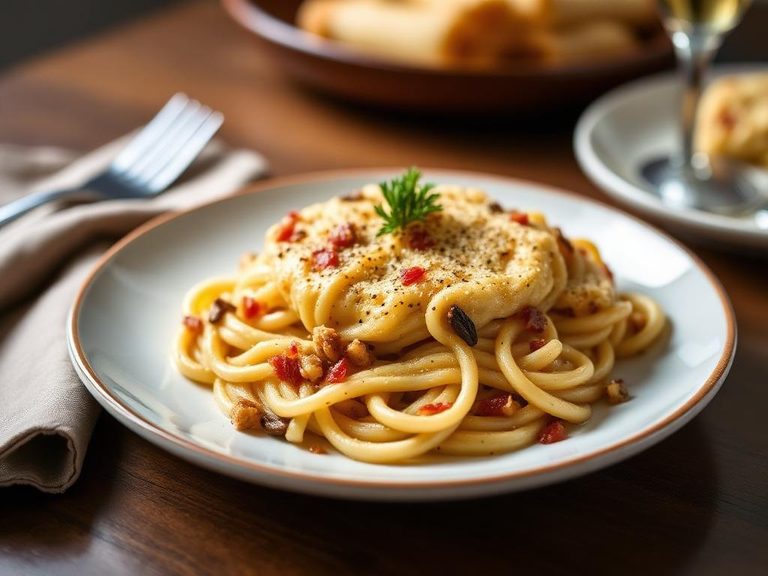
🍽️ Popular dishes
🌍 Where it's eaten
💡 Did you know?
The word 'lasagna' likely derives from the Greek 'lasanon,' meaning a large cooking pot or chamber pot, which was later adopted by the Romans to refer to the flat pasta sheets themselves.
Full nutrition (USDA data · scales with serving)
| Water | 76.4 g |
| Energy | 101 kcal |
| Energy | 424 kj |
| Protein | 6.8 g |
| Total lipid (fat) | 2.2 g |
| Ash | 1.1 g |
| Carbohydrate, by difference | 13.5 g |
| Fiber, total dietary | 1.3 g |
| Sucrose | 0.50 g |
| Glucose | 0.75 g |
| Fructose | 0.76 g |
| Starch | 9.4 g |
| Calcium, Ca | 108 mg |
| Iron, Fe | 0.97 mg |
| Magnesium, Mg | 19.0 mg |
| Phosphorus, P | 34.0 mg |
| Potassium, K | 150 mg |
| Sodium, Na | 181 mg |
| Zinc, Zn | 0.86 mg |
| Copper, Cu | 0.17 mg |
| Manganese, Mn | 0.21 mg |
| Selenium, Se | 13.0 ug |
| Vitamin C, total ascorbic acid | 17.9 mg |
| Thiamin | 0.04 mg |
| Riboflavin | 0.13 mg |
| Niacin | 1.2 mg |
| Pantothenic acid | 0.11 mg |
| Vitamin B-6 | 0.12 mg |
| Folate, total | 38.0 ug |
| Vitamin B-12 | 0.45 ug |
Fat & fatty acid profile (per 100g)
| Fatty acids, total saturated | 0.97 g |
| SFA 8:0 | 0.00 g |
| SFA 10:0 | 0.02 g |
| SFA 12:0 | 0.03 g |
| SFA 13:0 | 0.00 g |
| SFA 14:0 | 0.12 g |
| SFA 15:0 | 0.02 g |
| SFA 16:0 | 0.52 g |
| SFA 17:0 | 0.02 g |
| SFA 18:0 | 0.24 g |
| SFA 20:0 | 0.01 g |
| SFA 22:0 | 0.01 g |
| Fatty acids, total monounsaturated | 0.70 g |
| MUFA 14:1 | 0.02 g |
| MUFA 16:1 | 0.05 g |
| MUFA 17:1 | 0.03 g |
| MUFA 18:1 | 0.60 g |
| MUFA 22:1 | 0.00 g |
| Fatty acids, total polyunsaturated | 0.28 g |
| PUFA 18:2 | 0.24 g |
| PUFA 18:3 | 0.03 g |
| PUFA 20:3 | 0.00 g |
| Cholesterol | 7.0 mg |
Amino acid profile (per 100g)
Estimated from Lasagna with meat sauce, frozen, prepared — USDA does not publish this profile for Lasagna with meat & sauce.
| Tryptophan | 0.09 g |
| Threonine | 0.22 g |
| Isoleucine | 0.22 g |
| Leucine | 0.58 g |
| Lysine | 0.49 g |
| Methionine | 0.16 g |
| Cystine | 0.12 g |
| Phenylalanine | 0.33 g |
| Tyrosine | 0.24 g |
| Valine | 0.28 g |
| Arginine | 0.33 g |
| Histidine | 0.18 g |
| Alanine | 0.30 g |
| Aspartic acid | 0.58 g |
| Glutamic acid | 1.9 g |
| Glycine | 0.28 g |
| Proline | 0.79 g |
| Serine | 0.37 g |
FAQ
How does the nutrition compare to homemade lasagna?
This frozen version is significantly lower in calories and fat, particularly saturated fat, than most traditional homemade recipes which use generous amounts of cheese and fatty meats. It is designed for portion control and convenience.
Is this a good option for a high-protein diet?
Yes, with 6.81g of protein per 100g, a standard 227g serving provides about 15.5g of protein, making it a decent protein source for a quick meal, though not as high as some dedicated protein-focused products.
Why might the texture be different from fresh lasagna?
Freezing and reheating can cause the pasta to become softer and the layers to meld together more. The low-fat cheese component may also melt differently, leading to a less gooey texture than a full-fat version.
Nutrient density (calculated · NRF9.3)
Nutrient Rich Foods index: beneficial nutrients (protein, fiber, vitamins, minerals) minus saturated fat, added sugar & sodium, per 100 kcal.
NRF9.3 index — Fulgoni, Keast & Drewnowski, 2009. Computed from USDA nutrients.
Weight-loss friendliness (composite index)
Energy density 1.01 kcal/g · 27% calories from protein · 1.3 g fiber · 0.0 g sugar per 100 g.
Composite of energy density (Rolls et al., 1999), protein & fiber satiety, minus sugar. A calculated heuristic — ranks satiety-per-calorie, not a clinical measure.
Dietary load (calculated from USDA values)
Potential renal acid load. Positive = acid-forming, negative = alkaline-forming.
Sodium-to-potassium ratio: 1.21 (lower is better — aim for ≤ 1)
Sodium:potassium per WHO potassium guidance. Computed from USDA nutrients.