

Beef, rib, small end (ribs 10-12), separable lean and fat, trimmed to 1/8" fat, prime, raw
Whole food · Beef Products

Photo: Wikipedia
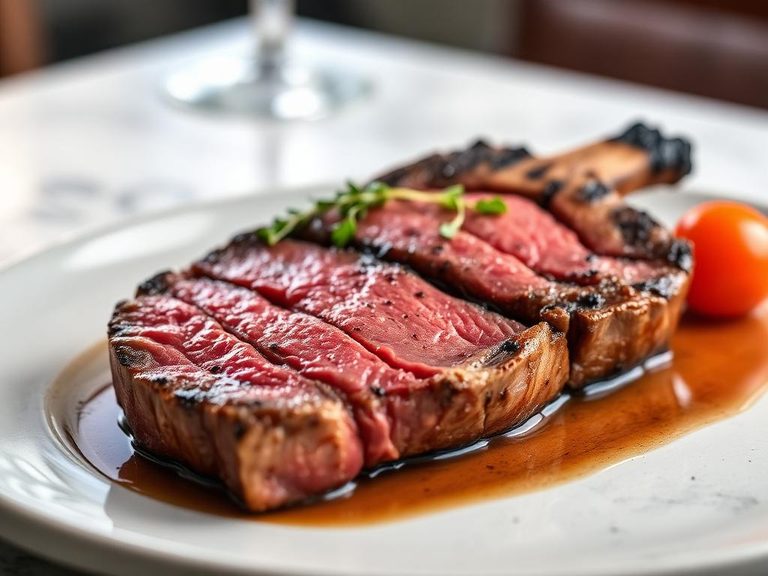
This is a prime-grade cut from the small end of the beef rib, prized for its rich marbling of intramuscular fat that melts during cooking, creating a buttery, deeply beefy flavor. The texture is exceptionally tender and succulent when prepared correctly, offering a luxurious mouthfeel. Nutritionally, it's a powerhouse of high-quality protein and energy-dense fat, with virtually no carbohydrates.
Calorie split: 20% protein · 0% carbs · 80% fat
↓ Full nutrition💚 Why it's loved
People adore this cut for its unparalleled marbling, which guarantees a rich, beefy flavor and melt-in-your-mouth tenderness. It's a centerpiece for celebratory meals, from classic American steakhouses to Sunday roasts, symbolizing indulgence and quality.
⚠️ Watch-outs & how to enjoy it better
The high fat content makes it calorie-dense and may not suit strict low-fat diets. Individuals monitoring saturated fat intake or with specific cardiovascular concerns should consume it in moderation. To counteract, practice strict portion control (see below) and pair it with fiber-rich, non-starchy vegetables like roasted broccoli or a crisp salad to balance the meal.
Key benefits
- Excellent source of complete, high-quality protein for muscle maintenance.
- Rich in heme iron, which is highly bioavailable for preventing iron deficiency.
- Provides essential B vitamins, particularly B12, crucial for nerve function and energy metabolism.
- Contains zinc, which supports immune system health and wound healing.
- Offers conjugated linoleic acid (CLA), a fatty acid studied for potential metabolic benefits.
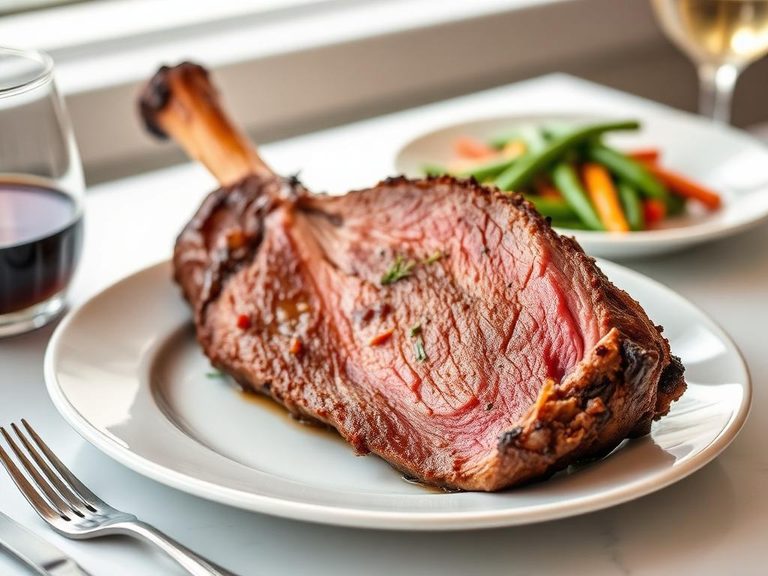
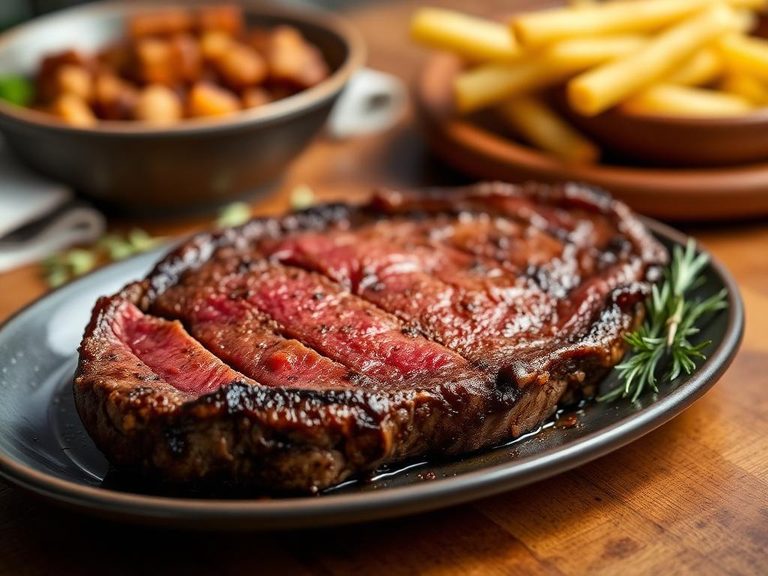
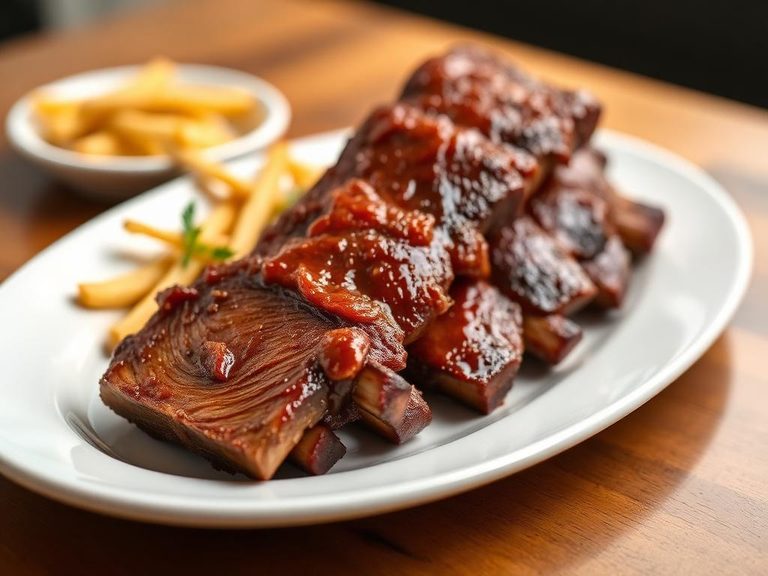
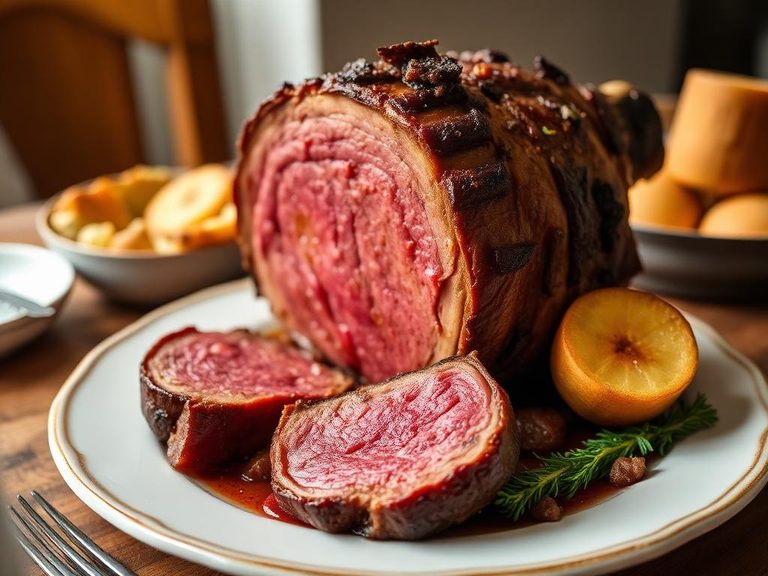
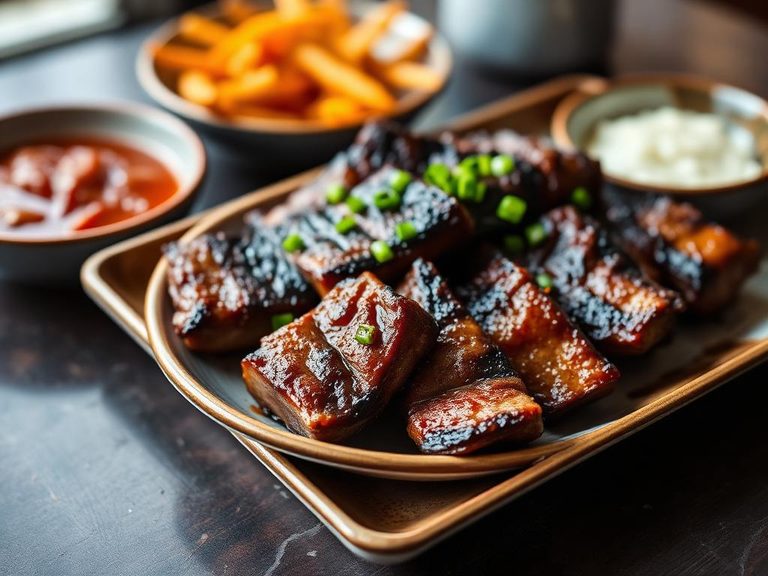
🍽️ Popular dishes
🌍 Where it's eaten
💡 Did you know?
The 'ribeye' steak actually comes from a specific muscle within this rib section called the longissimus dorsi, which is prized for its perfect balance of tenderness, flavor, and marbling.
Full nutrition (USDA data · scales with serving)
| Water | 53.2 g |
| Energy | 335 kcal |
| Energy | 1401 kj |
| Protein | 16.7 g |
| Total lipid (fat) | 29.2 g |
| Ash | 0.80 g |
| Carbohydrate, by difference | 0.06 g |
| Fiber, total dietary | 0.00 g |
| Calcium, Ca | 10.0 mg |
| Iron, Fe | 1.8 mg |
| Magnesium, Mg | 17.0 mg |
| Phosphorus, P | 160 mg |
| Potassium, K | 286 mg |
| Sodium, Na | 53.0 mg |
| Zinc, Zn | 3.6 mg |
| Copper, Cu | 0.06 mg |
| Manganese, Mn | 0.01 mg |
| Selenium, Se | 16.3 ug |
| Vitamin C, total ascorbic acid | 0.00 mg |
| Thiamin | 0.08 mg |
| Riboflavin | 0.13 mg |
| Niacin | 3.1 mg |
| Pantothenic acid | 0.28 mg |
| Vitamin B-6 | 0.35 mg |
| Folate, total | 5.0 ug |
| Folic acid | 0.00 ug |
| Folate, food | 5.0 ug |
| Folate, DFE | 5.0 ug |
| Vitamin B-12 | 3.0 ug |
| Vitamin A, RAE | 0.00 ug |
| Retinol | 0.00 ug |
| Vitamin A, IU | 0.00 iu |
Fat & fatty acid profile (per 100g)
| Fatty acids, total saturated | 12.1 g |
| SFA 10:0 | 0.10 g |
| SFA 12:0 | 0.07 g |
| SFA 14:0 | 0.94 g |
| SFA 16:0 | 7.1 g |
| SFA 18:0 | 3.7 g |
| Fatty acids, total monounsaturated | 12.8 g |
| MUFA 16:1 | 1.4 g |
| MUFA 18:1 | 11.2 g |
| MUFA 20:1 | 0.04 g |
| Fatty acids, total polyunsaturated | 1.0 g |
| PUFA 18:2 | 0.68 g |
| PUFA 18:3 | 0.32 g |
| PUFA 20:4 | 0.03 g |
| Cholesterol | 70.0 mg |
Amino acid profile (per 100g)
| Tryptophan | 0.19 g |
| Threonine | 0.73 g |
| Isoleucine | 0.75 g |
| Leucine | 1.3 g |
| Lysine | 1.4 g |
| Methionine | 0.43 g |
| Cystine | 0.19 g |
| Phenylalanine | 0.65 g |
| Tyrosine | 0.56 g |
| Valine | 0.81 g |
| Arginine | 1.1 g |
| Histidine | 0.57 g |
| Alanine | 1.0 g |
| Aspartic acid | 1.5 g |
| Glutamic acid | 2.5 g |
| Glycine | 0.91 g |
| Proline | 0.74 g |
| Serine | 0.64 g |
FAQ
What's the difference between this cut and a standard ribeye steak?
This description specifies a 'prime' grade cut from the small end (ribs 10-12) of the rib primal, trimmed to 1/8" fat. A standard ribeye could be from a lower grade (like Choice or Select), a different part of the rib, or have more external fat left on. The 'prime' grade and specific trimming ensure superior marbling and consistency.
How should I cook this cut to maximize its qualities?
For steaks, high-heat methods like grilling, broiling, or pan-searing are ideal to create a flavorful crust while keeping the interior juicy. For roasts, slow-roasting at a lower temperature first, then finishing with a high-heat sear, is classic. Always use a meat thermometer to avoid overcooking.
Is the fat in this cut unhealthy?
It contains a significant amount of saturated fat, which should be consumed in moderation as part of a balanced diet. However, it also provides beneficial nutrients like iron and B12, and the fat contributes to the flavor and satisfaction of the meal. Balance is key.
Nutrient density (calculated · NRF9.3)
Nutrient Rich Foods index: beneficial nutrients (protein, fiber, vitamins, minerals) minus saturated fat, added sugar & sodium, per 100 kcal.
NRF9.3 index — Fulgoni, Keast & Drewnowski, 2009. Computed from USDA nutrients.
Weight-loss friendliness (composite index)
Energy density 3.35 kcal/g · 20% calories from protein · 0.0 g fiber · 0.0 g sugar per 100 g.
Composite of energy density (Rolls et al., 1999), protein & fiber satiety, minus sugar. A calculated heuristic — ranks satiety-per-calorie, not a clinical measure.
Dietary load (calculated from USDA values)
Potential renal acid load. Positive = acid-forming, negative = alkaline-forming.
Sodium-to-potassium ratio: 0.19 (lower is better — aim for ≤ 1)
Sodium:potassium per WHO potassium guidance. Computed from USDA nutrients.