

Frozen novelties, fruit and juice bars
Whole food · Sweets
A chilled, icy treat made from fruit juice or purée, offering a refreshing burst of flavor with a smooth, melt-in-your-mouth texture. Nutritionally, it's a low-fat, low-calorie way to satisfy a sweet tooth, providing a quick source of carbohydrates for energy. Its primary appeal lies in its simplicity and the pure, unadulterated taste of its fruit base.
Calorie split: 6% protein · 93% carbs · 1% fat
↓ Full nutrition💚 Why it's loved
People adore these for their nostalgic, summery appeal and the way they deliver a clean, intense fruit flavor without heaviness. Their versatility ranges from a post-workout refresher to a kid-friendly snack, deeply embedded in warm-weather culture.
⚠️ Watch-outs & how to enjoy it better
The high sugar content (over 17g per 100g) can cause rapid blood-sugar spikes, especially for those with insulin sensitivity. To counteract this, enjoy a single bar as a treat rather than a staple, or pair it with a source of protein or healthy fat (like a handful of nuts) to slow sugar absorption. Those monitoring sugar intake should be mindful of portion size.
Key benefits
- Low in fat and calories, making it a lighter dessert option.
- Provides a quick source of natural fruit sugars for energy.
- Often contains a small amount of dietary fiber from fruit pulp.
- Hydrating due to its high water content.
- Simple ingredient list, often just fruit juice and water.
🍽️ Popular dishes

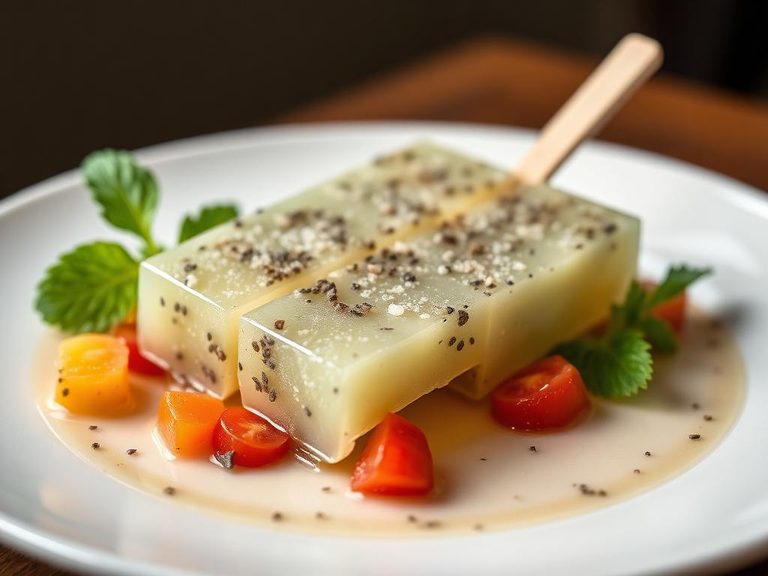
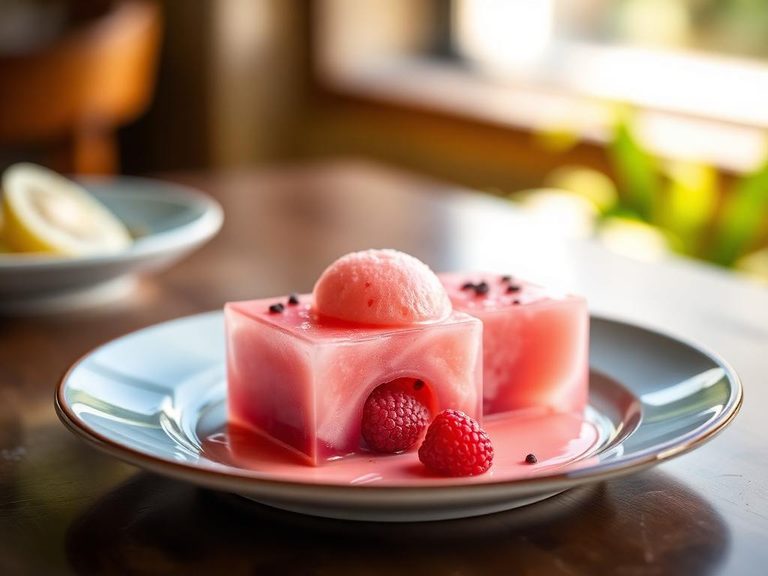
🌍 Where it's eaten
💡 Did you know?
The classic 'fruit bar' shape was popularized in the 1920s by a Kansas City grocer who froze fruit juice in metal trays with wooden sticks, creating the prototype for the modern popsicle.
Full nutrition (USDA data · scales with serving)
| Water | 78.3 g |
| Energy | 87.0 kcal |
| Energy | 362 kj |
| Protein | 1.2 g |
| Total lipid (fat) | 0.10 g |
| Ash | 0.20 g |
| Carbohydrate, by difference | 20.2 g |
| Fiber, total dietary | 1.0 g |
| Total Sugars | 17.5 g |
| Calcium, Ca | 5.0 mg |
| Iron, Fe | 0.19 mg |
| Magnesium, Mg | 4.0 mg |
| Phosphorus, P | 6.0 mg |
| Potassium, K | 53.0 mg |
| Sodium, Na | 4.0 mg |
| Zinc, Zn | 0.05 mg |
| Copper, Cu | 0.00 mg |
| Manganese, Mn | 0.17 mg |
| Selenium, Se | 0.20 ug |
| Vitamin C, total ascorbic acid | 9.5 mg |
| Thiamin | 0.01 mg |
| Riboflavin | 0.02 mg |
| Niacin | 0.16 mg |
| Pantothenic acid | 0.04 mg |
| Vitamin B-6 | 0.03 mg |
| Folate, total | 7.0 ug |
| Folic acid | 0.00 ug |
| Folate, food | 7.0 ug |
| Folate, DFE | 7.0 ug |
| Choline, total | 4.0 mg |
| Vitamin B-12 | 0.00 ug |
| Vitamin B-12, added | 0.00 ug |
| Vitamin A, RAE | 1.0 ug |
| Retinol | 0.00 ug |
| Carotene, beta | 11.0 ug |
| Carotene, alpha | 0.00 ug |
| Cryptoxanthin, beta | 0.00 ug |
| Vitamin A, IU | 18.0 iu |
| Lycopene | 0.00 ug |
| Lutein + zeaxanthin | 34.0 ug |
| Vitamin E (alpha-tocopherol) | 0.00 mg |
| Vitamin E, added | 0.00 mg |
| Vitamin D (D2 + D3), International Units | 0.00 iu |
| Vitamin D (D2 + D3) | 0.00 ug |
| Vitamin K (phylloquinone) | 0.90 ug |
| Alcohol, ethyl | 0.00 g |
| Caffeine | 0.00 mg |
| Theobromine | 0.00 mg |
Fat & fatty acid profile (per 100g)
| Fatty acids, total saturated | 0.00 g |
| SFA 4:0 | 0.00 g |
| SFA 6:0 | 0.00 g |
| SFA 8:0 | 0.00 g |
| SFA 10:0 | 0.00 g |
| SFA 12:0 | 0.00 g |
| SFA 14:0 | 0.00 g |
| SFA 16:0 | 0.00 g |
| SFA 18:0 | 0.00 g |
| Fatty acids, total monounsaturated | 0.00 g |
| MUFA 16:1 | 0.00 g |
| MUFA 18:1 | 0.00 g |
| MUFA 20:1 | 0.00 g |
| MUFA 22:1 | 0.00 g |
| Fatty acids, total polyunsaturated | 0.03 g |
| PUFA 18:2 | 0.02 g |
| PUFA 18:3 | 0.01 g |
| PUFA 18:4 | 0.00 g |
| PUFA 20:4 | 0.00 g |
| PUFA 20:5 n-3 (EPA) | 0.00 g |
| PUFA 22:5 n-3 (DPA) | 0.00 g |
| PUFA 22:6 n-3 (DHA) | 0.00 g |
| Cholesterol | 0.00 mg |
FAQ
Are fruit and juice bars a good source of vitamins?
While they contain fruit juice, the freezing process can degrade some heat-sensitive vitamins like Vitamin C. They are better considered a source of hydration and quick energy rather than a significant vitamin supplement.
What's the difference between a fruit bar and a juice bar?
A fruit bar is typically made from fruit purée or juice with pulp, giving it more body and fiber. A juice bar is made from filtered juice, resulting in a smoother, icier texture with less fiber.
Can I make these at home?
Absolutely! Blend your favorite fruit with a little water or juice, pour into molds, and freeze. Homemade versions let you control the sugar content and add extras like chia seeds or yogurt for extra nutrition.
Nutrient density (calculated · NRF9.3)
Nutrient Rich Foods index: beneficial nutrients (protein, fiber, vitamins, minerals) minus saturated fat, added sugar & sodium, per 100 kcal.
NRF9.3 index — Fulgoni, Keast & Drewnowski, 2009. Computed from USDA nutrients.
Weight-loss friendliness (composite index)
Energy density 0.87 kcal/g · 6% calories from protein · 1.0 g fiber · 17.5 g sugar per 100 g.
Composite of energy density (Rolls et al., 1999), protein & fiber satiety, minus sugar. A calculated heuristic — ranks satiety-per-calorie, not a clinical measure.
Dietary load (calculated from USDA values)
Potential renal acid load. Positive = acid-forming, negative = alkaline-forming.
Sodium-to-potassium ratio: 0.08 (lower is better — aim for ≤ 1)
Sodium:potassium per WHO potassium guidance. Computed from USDA nutrients.