

Peas, green, sweet, canned, sodium added, sugar added, drained and rinsed
Whole food · Vegetables and Vegetable Products

Photo: Wikipedia
These are sweet green peas, canned and preserved with added salt and sugar, then rinsed to reduce excess sodium. They have a soft, slightly mealy texture and a distinctively sweet, starchy flavor. Nutritionally, they offer a decent source of plant-based protein with moderate carbohydrates.
Calorie split: 24% protein · 63% carbs · 13% fat
↓ Full nutrition💚 Why it's loved
People love them for their inherent sweetness and satisfying, hearty texture that holds up well in both hot and cold dishes. They are a beloved, versatile ingredient in everything from simple side dishes to complex stews and salads across many cuisines.
⚠️ Watch-outs & how to enjoy it better
The added sugar and sodium can be a concern for those monitoring blood sugar or salt intake. To counteract, always rinse them thoroughly under cold water to wash away excess salt and some sugar, and pair them with a healthy fat (like a drizzle of olive oil) or protein source to help blunt any glycemic response.
Key benefits
- Good source of plant-based protein
- Provides quick energy from carbohydrates
- Contains essential vitamins like K and B vitamins
- Convenient and shelf-stable pantry staple
- Low in fat
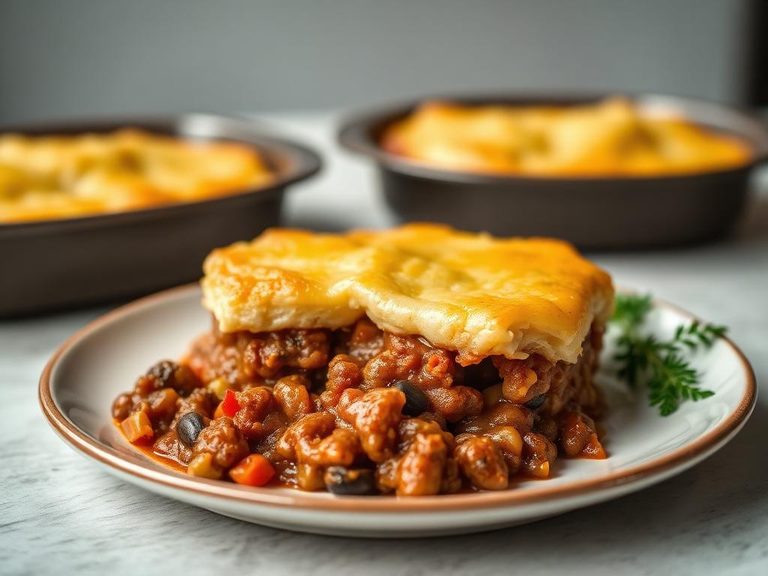
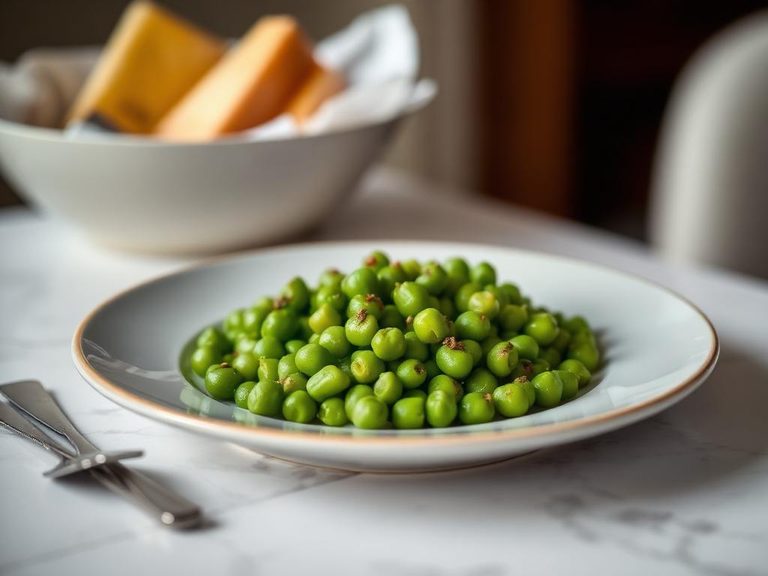
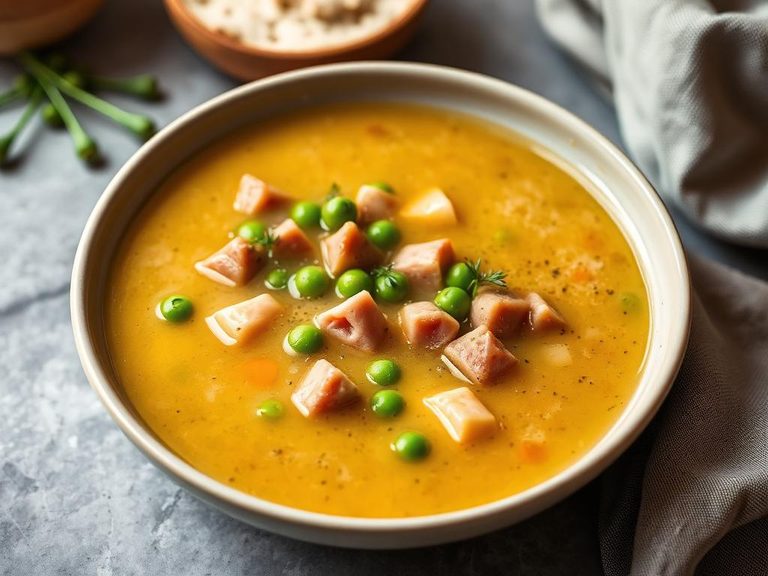
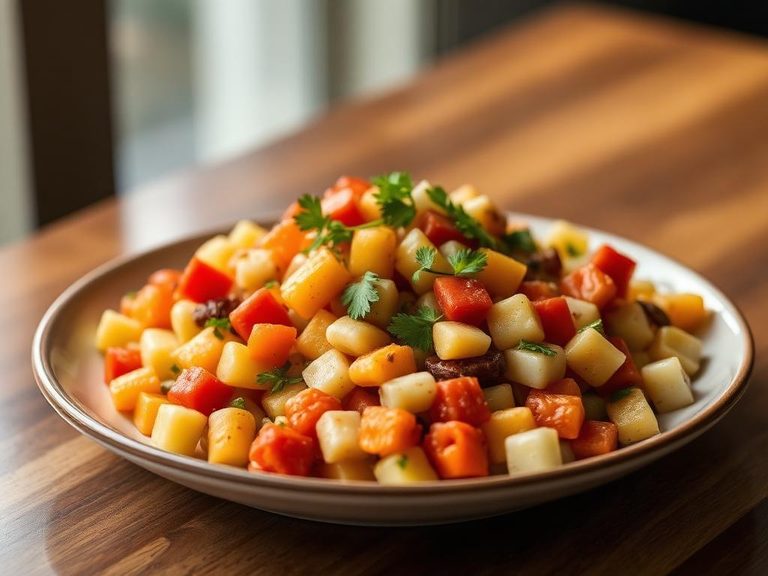
🍽️ Popular dishes


🌍 Where it's eaten
💡 Did you know?
Despite their sweet taste, canned green peas have a lower glycemic index (around 39) than many other starchy vegetables, partly due to their protein and fiber content, even when rinsed.
Full nutrition (USDA data · scales with serving)
| Water | 80.5 g |
| Energy (Atwater General Factors) | 80.1 kcal |
| Energy (Atwater Specific Factors) | 77.8 kcal |
| Nitrogen | 0.76 g |
| Protein | 4.7 g |
| Total lipid (fat) | 1.2 g |
| Ash | 0.88 g |
| Carbohydrate, by difference | 12.7 g |
| Total dietary fiber (AOAC 2011.25) | 6.0 g |
| Starch | 4.5 g |
| Resistant starch | 2.0 g |
| Calcium, Ca | 28.2 mg |
| Iron, Fe | 1.1 mg |
| Magnesium, Mg | 21.9 mg |
| Phosphorus, P | 77.7 mg |
| Potassium, K | 109 mg |
| Sodium, Na | 207 mg |
| Zinc, Zn | 0.71 mg |
| Copper, Cu | 0.12 mg |
| Manganese, Mn | 0.28 mg |
Fat & fatty acid profile (per 100g)
Estimated from Peas and onions, frozen, cooked, boiled, drained, with salt — USDA does not publish this profile for Peas.
| Fatty acids, total saturated | 0.04 g |
| SFA 4:0 | 0.00 g |
| SFA 6:0 | 0.00 g |
| SFA 8:0 | 0.00 g |
| SFA 10:0 | 0.00 g |
| SFA 12:0 | 0.00 g |
| SFA 14:0 | 0.00 g |
| SFA 16:0 | 0.03 g |
| SFA 18:0 | 0.00 g |
| Fatty acids, total monounsaturated | 0.02 g |
| MUFA 16:1 | 0.00 g |
| MUFA 18:1 | 0.02 g |
| MUFA 20:1 | 0.00 g |
| MUFA 22:1 | 0.00 g |
| Fatty acids, total polyunsaturated | 0.09 g |
| PUFA 18:2 | 0.08 g |
| PUFA 18:3 | 0.02 g |
| PUFA 18:4 | 0.00 g |
| PUFA 20:4 | 0.00 g |
| PUFA 20:5 n-3 (EPA) | 0.00 g |
| PUFA 22:5 n-3 (DPA) | 0.00 g |
| PUFA 22:6 n-3 (DHA) | 0.00 g |
| Fatty acids, total trans | 0.00 g |
| Cholesterol | 0.00 mg |
Amino acid profile (per 100g)
Estimated from Peas and onions, frozen, cooked, boiled, drained, with salt — USDA does not publish this profile for Peas.
| Tryptophan | 0.02 g |
| Threonine | 0.09 g |
| Isoleucine | 0.09 g |
| Leucine | 0.15 g |
| Lysine | 0.15 g |
| Methionine | 0.04 g |
| Cystine | 0.02 g |
| Phenylalanine | 0.09 g |
| Tyrosine | 0.05 g |
| Valine | 0.11 g |
| Arginine | 0.21 g |
| Histidine | 0.05 g |
| Alanine | 0.11 g |
| Aspartic acid | 0.23 g |
| Glutamic acid | 0.35 g |
| Glycine | 0.09 g |
| Proline | 0.08 g |
| Serine | 0.08 g |
FAQ
Why are canned peas often labeled 'sodium added' and 'sugar added'?
Sodium is added as a preservative and flavor enhancer, while sugar helps maintain the peas' bright green color and offsets any metallic taste from the canning process. Rinsing them well mitigates these additions.
How do canned peas differ nutritionally from frozen or fresh peas?
Canned peas are typically softer and lower in some heat-sensitive vitamins like Vitamin C due to processing. They also contain added sodium and sugar, whereas frozen peas are usually just peas, and fresh peas are the most nutrient-dense but perishable.
Can I use canned peas directly without cooking?
Yes, they are pre-cooked and safe to eat straight from the can. However, they are most often heated and incorporated into recipes to enhance their flavor and texture.
Nutrient density (calculated · NRF9.3)
Nutrient Rich Foods index: beneficial nutrients (protein, fiber, vitamins, minerals) minus saturated fat, added sugar & sodium, per 100 kcal.
NRF9.3 index — Fulgoni, Keast & Drewnowski, 2009. Computed from USDA nutrients.
Weight-loss friendliness (composite index)
Energy density 0.80 kcal/g · 24% calories from protein · 0.0 g fiber · 0.0 g sugar per 100 g.
Composite of energy density (Rolls et al., 1999), protein & fiber satiety, minus sugar. A calculated heuristic — ranks satiety-per-calorie, not a clinical measure.
Dietary load (calculated from USDA values)
Potential renal acid load. Positive = acid-forming, negative = alkaline-forming.
Sodium-to-potassium ratio: 1.90 (lower is better — aim for ≤ 1)
Sodium:potassium per WHO potassium guidance. Computed from USDA nutrients.