

Cake, yellow, unenriched, dry mix
Whole food · Baked Products

Photo: Wikipedia
This is the powdered foundation for a classic golden butter cake, a pantry staple designed for convenience. When mixed with eggs, oil, and water, it bakes into a tender, moist crumb with a mild, sweet vanilla flavor and a fine, uniform texture. Nutritionally, it's a dense source of quick energy from carbohydrates, with a modest protein content from the wheat flour base.
Calorie split: 4% protein · 72% carbs · 24% fat
↓ Full nutrition💚 Why it's loved
People love it for its nostalgic, comforting flavor and the sheer ease of creating a homemade dessert from a simple mix. Its neutral sweetness makes it a perfect canvas for endless customization with frostings, fillings, and toppings.
⚠️ Watch-outs & how to enjoy it better
The mix is high in refined carbohydrates and low in fiber, which can lead to rapid blood-sugar spikes, especially when consumed alone. It often contains sodium and may be processed in facilities with common allergens like milk, soy, and nuts. To counteract this, pair a slice with a source of protein (like milk or nuts) or healthy fat (like a dollop of Greek yogurt) to slow digestion, and always practice portion control.
Key benefits
- Provides quick energy from a high carbohydrate content.
- Offers a consistent, foolproof base for home baking.
- Contains a modest amount of plant-based protein from wheat flour.
- Long shelf life makes it a reliable pantry item.
🍽️ Popular dishes


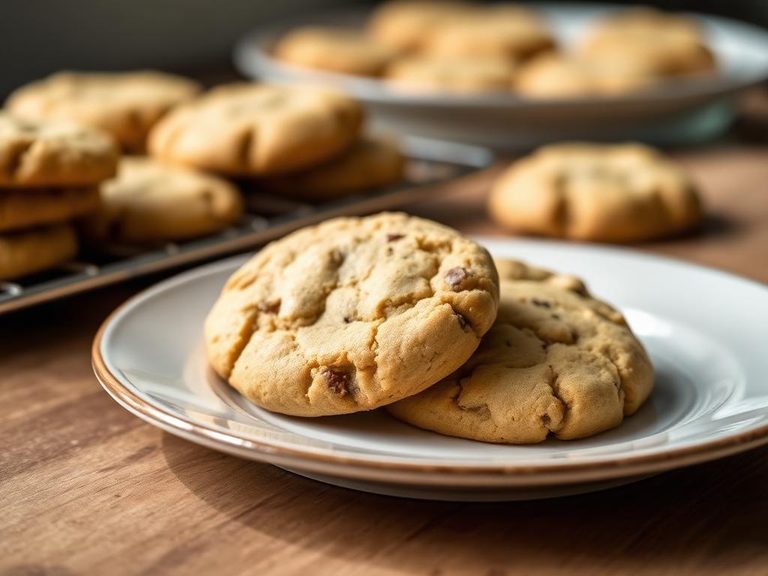
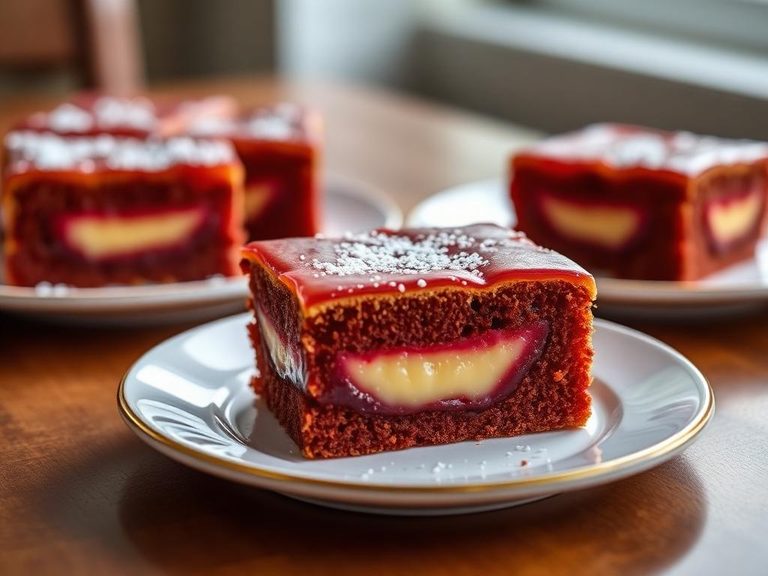
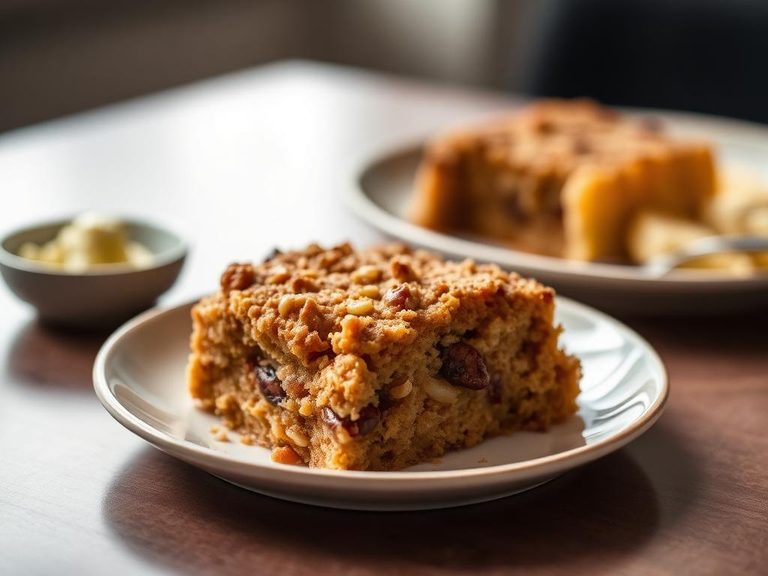
🌍 Where it's eaten
💡 Did you know?
The first commercial cake mixes, introduced in the 1940s, were complete with dehydrated eggs, but home bakers found them too easy and felt guilty, so manufacturers later removed the eggs to restore a sense of 'from-scratch' accomplishment.
Full nutrition (USDA data · scales with serving)
| Water | 3.7 g |
| Energy | 432 kcal |
| Energy | 1807 kj |
| Protein | 4.4 g |
| Total lipid (fat) | 11.6 g |
| Ash | 2.3 g |
| Carbohydrate, by difference | 78.1 g |
| Fiber, total dietary | 1.1 g |
| Calcium, Ca | 135 mg |
| Iron, Fe | 0.48 mg |
| Magnesium, Mg | 10.0 mg |
| Phosphorus, P | 310 mg |
| Potassium, K | 82.0 mg |
| Sodium, Na | 657 mg |
| Zinc, Zn | 0.27 mg |
| Copper, Cu | 0.07 mg |
| Manganese, Mn | 0.19 mg |
| Vitamin C, total ascorbic acid | 0.20 mg |
| Thiamin | 0.08 mg |
| Riboflavin | 0.05 mg |
| Niacin | 0.31 mg |
| Pantothenic acid | 0.36 mg |
| Vitamin B-6 | 0.08 mg |
| Folate, total | 9.0 ug |
| Folic acid | 0.00 ug |
| Folate, food | 9.0 ug |
| Folate, DFE | 9.0 ug |
| Vitamin B-12 | 0.10 ug |
| Vitamin A, RAE | 0.00 ug |
| Retinol | 0.00 ug |
| Vitamin A, IU | 1.0 iu |
Fat & fatty acid profile (per 100g)
| Fatty acids, total saturated | 1.7 g |
| SFA 4:0 | 0.00 g |
| SFA 6:0 | 0.00 g |
| SFA 8:0 | 0.00 g |
| SFA 10:0 | 0.00 g |
| SFA 12:0 | 0.00 g |
| SFA 14:0 | 0.01 g |
| SFA 16:0 | 1.2 g |
| SFA 18:0 | 0.56 g |
| Fatty acids, total monounsaturated | 4.9 g |
| MUFA 16:1 | 0.05 g |
| MUFA 18:1 | 4.8 g |
| Fatty acids, total polyunsaturated | 4.4 g |
| PUFA 18:2 | 4.1 g |
| PUFA 18:3 | 0.30 g |
| Cholesterol | 2.0 mg |
Amino acid profile (per 100g)
| Tryptophan | 0.06 g |
| Threonine | 0.14 g |
| Isoleucine | 0.19 g |
| Leucine | 0.33 g |
| Lysine | 0.20 g |
| Methionine | 0.08 g |
| Cystine | 0.08 g |
| Phenylalanine | 0.20 g |
| Tyrosine | 0.14 g |
| Valine | 0.21 g |
| Arginine | 0.16 g |
| Histidine | 0.09 g |
| Alanine | 0.13 g |
| Aspartic acid | 0.22 g |
| Glutamic acid | 1.3 g |
| Glycine | 0.13 g |
| Proline | 0.46 g |
| Serine | 0.23 g |
FAQ
Can I substitute oil for butter in the mix?
Yes, most mixes allow this substitution. Use the same amount of oil as the recipe calls for in butter. The result will be a moister, denser cake with a less pronounced butter flavor.
Why is my cake mix cake so flat?
This is often due to over-mixing the batter after adding the wet ingredients, which develops too much gluten and can cause the cake to rise and then collapse. Mix just until the ingredients are combined.
Does the 'unenriched' label matter?
It means the flour in the mix hasn't had certain B vitamins and iron added back after processing. For most people eating a varied diet, the nutritional impact is minimal, but it's a detail for those tracking specific micronutrients.
Nutrient density (calculated · NRF9.3)
Nutrient Rich Foods index: beneficial nutrients (protein, fiber, vitamins, minerals) minus saturated fat, added sugar & sodium, per 100 kcal.
NRF9.3 index — Fulgoni, Keast & Drewnowski, 2009. Computed from USDA nutrients.
Weight-loss friendliness (composite index)
Energy density 4.32 kcal/g · 4% calories from protein · 1.1 g fiber · 0.0 g sugar per 100 g.
Composite of energy density (Rolls et al., 1999), protein & fiber satiety, minus sugar. A calculated heuristic — ranks satiety-per-calorie, not a clinical measure.
Dietary load (calculated from USDA values)
Potential renal acid load. Positive = acid-forming, negative = alkaline-forming.
Sodium-to-potassium ratio: 8.01 (lower is better — aim for ≤ 1)
Sodium:potassium per WHO potassium guidance. Computed from USDA nutrients.