

Breakfast bar, NFS
Common food

Photo: Wikipedia
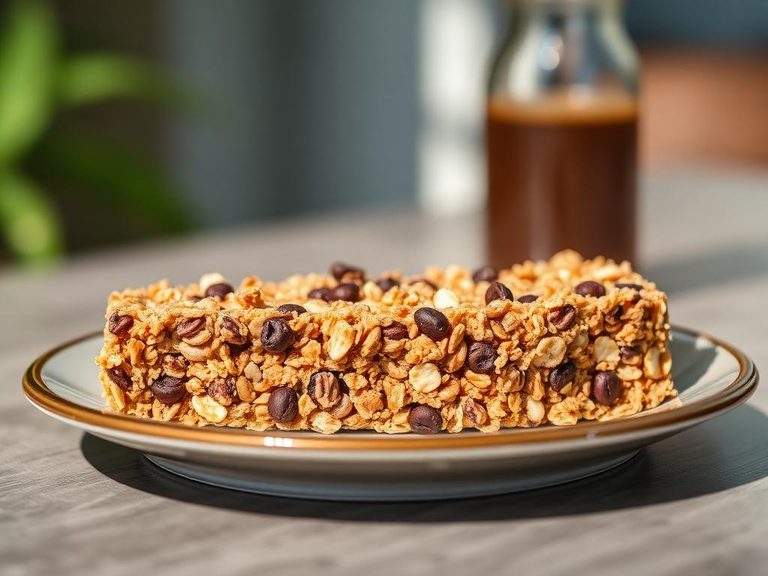
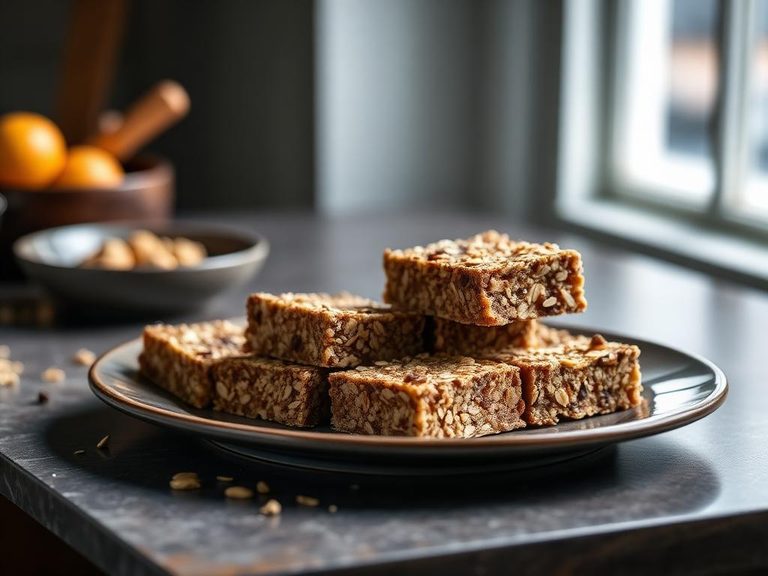
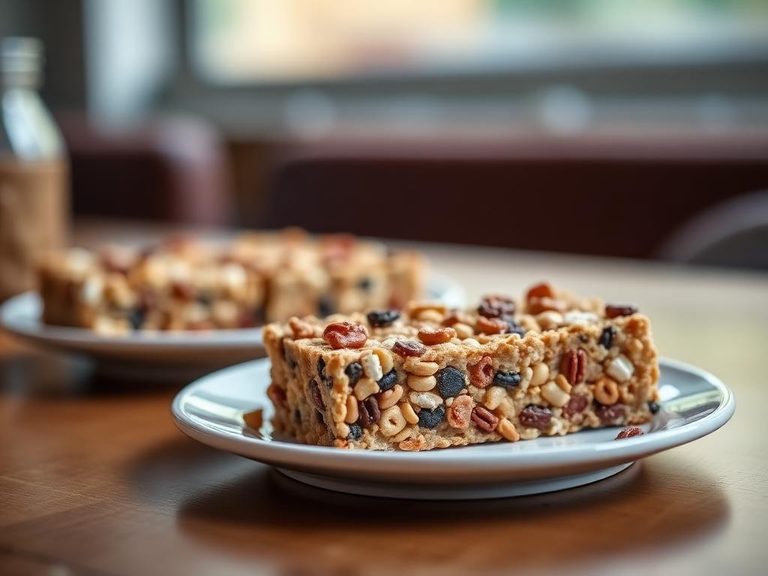
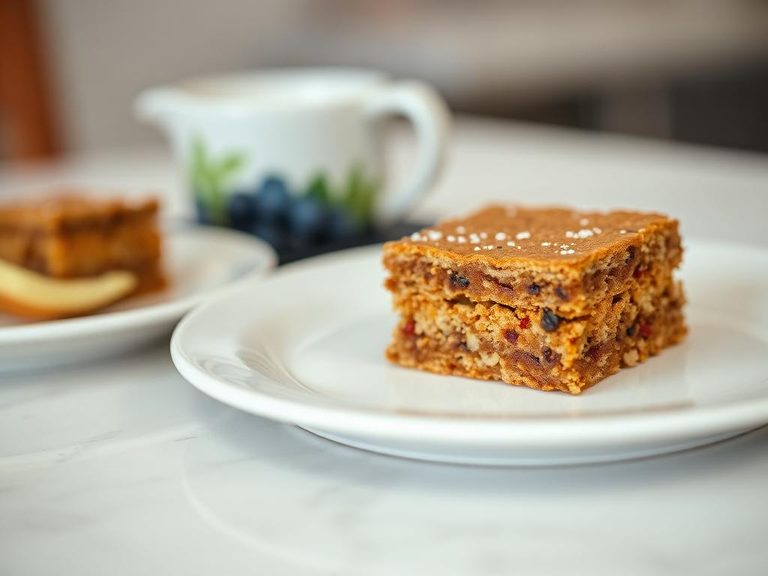
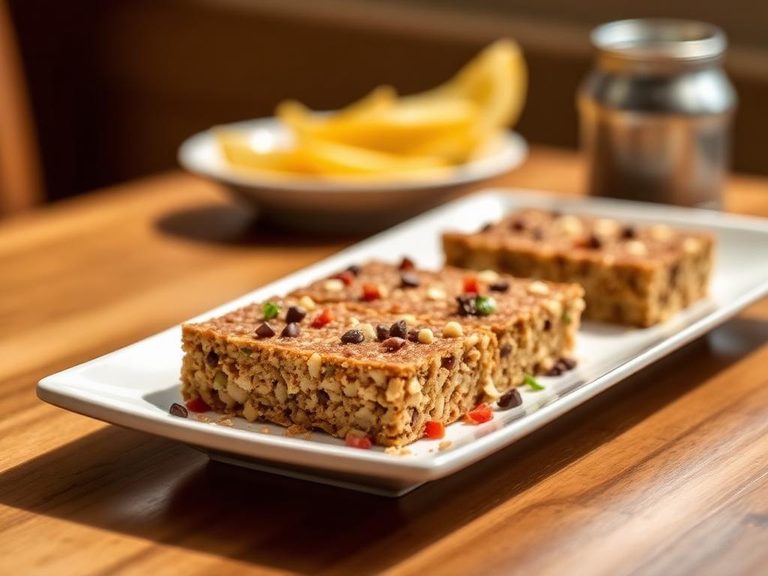
A Breakfast bar, NFS (Not Further Specified) is a dense, chewy, pre-packaged snack bar designed for quick morning energy. Its texture ranges from soft and oat-based to crisp and layered, with a dominant sweet flavor profile often derived from syrups, sugars, and dried fruits. Nutritionally, it is a concentrated source of carbohydrates, providing a quick energy boost but with minimal protein and fiber.
Calorie split: 5% protein · 77% carbs · 18% fat
↓ Full nutrition💚 Why it's loved
People love breakfast bars for their unmatched convenience and sweet, comforting taste that makes a rushed morning feel a bit more indulgent. They are a cultural staple of the on-the-go lifestyle, fitting perfectly into a bag, desk drawer, or gym kit.
⚠️ Watch-outs & how to enjoy it better
The high sugar content (35.1g per 100g) can lead to a rapid blood-sugar spike followed by a crash, leaving you hungry soon after. Many bars are also highly processed and may contain common allergens like nuts, soy, or wheat. To counteract this, pair the bar with a source of protein or healthy fat (like Greek yogurt or a handful of nuts) to slow sugar absorption, and practice strict portion control by choosing a smaller bar.
Key benefits
- Provides a rapid source of energy from carbohydrates.
- Offers a convenient, portable, and shelf-stable meal or snack option.
- Can be a vehicle for fortified vitamins and minerals in some formulations.
- Serves as a quick calorie source for athletes or active individuals.
🍽️ Popular dishes

🌍 Where it's eaten
💡 Did you know?
The modern breakfast bar's ancestor is the ' flapjack,' which in the UK is a baked bar made from rolled oats, butter, brown sugar, and golden syrup, with a texture much denser and chewier than its American oatmeal-cookie counterpart.
Full nutrition (USDA data · scales with serving)
| Water | 14.5 g |
| Energy | 376 kcal |
| Protein | 4.4 g |
| Total lipid (fat) | 7.5 g |
| Carbohydrate, by difference | 72.8 g |
| Fiber, total dietary | 2.1 g |
| Total Sugars | 35.1 g |
| Calcium, Ca | 41.0 mg |
| Iron, Fe | 4.9 mg |
| Magnesium, Mg | 27.0 mg |
| Phosphorus, P | 103 mg |
| Potassium, K | 197 mg |
| Sodium, Na | 337 mg |
| Zinc, Zn | 4.1 mg |
| Copper, Cu | 0.10 mg |
| Selenium, Se | 15.0 ug |
| Vitamin C, total ascorbic acid | 0.00 mg |
| Thiamin | 1.0 mg |
| Riboflavin | 1.1 mg |
| Niacin | 13.5 mg |
| Vitamin B-6 | 1.4 mg |
| Folate, total | 108 ug |
| Folic acid | 95.0 ug |
| Folate, food | 13.0 ug |
| Folate, DFE | 174 ug |
| Choline, total | 34.3 mg |
| Vitamin B-12 | 0.00 ug |
| Vitamin B-12, added | 0.00 ug |
| Vitamin A, RAE | 608 ug |
| Retinol | 608 ug |
| Carotene, beta | 0.00 ug |
| Carotene, alpha | 0.00 ug |
| Cryptoxanthin, beta | 0.00 ug |
| Lycopene | 0.00 ug |
| Lutein + zeaxanthin | 40.0 ug |
| Vitamin E (alpha-tocopherol) | 0.76 mg |
| Vitamin E, added | 0.00 mg |
| Vitamin D (D2 + D3) | 0.00 ug |
| Vitamin K (phylloquinone) | 13.8 ug |
| Alcohol, ethyl | 0.00 g |
| Caffeine | 0.00 mg |
| Theobromine | 0.00 mg |
Fat & fatty acid profile (per 100g)
| Fatty acids, total saturated | 1.5 g |
| SFA 4:0 | 0.00 g |
| SFA 6:0 | 0.00 g |
| SFA 8:0 | 0.00 g |
| SFA 10:0 | 0.00 g |
| SFA 12:0 | 0.00 g |
| SFA 14:0 | 0.00 g |
| SFA 16:0 | 0.86 g |
| SFA 18:0 | 0.15 g |
| Fatty acids, total monounsaturated | 5.0 g |
| MUFA 16:1 | 0.05 g |
| MUFA 18:1 | 5.0 g |
| MUFA 20:1 | 0.02 g |
| MUFA 22:1 | 0.00 g |
| Fatty acids, total polyunsaturated | 0.90 g |
| PUFA 18:2 | 0.85 g |
| PUFA 18:3 | 0.06 g |
| PUFA 18:4 | 0.00 g |
| PUFA 20:4 | 0.00 g |
| PUFA 20:5 n-3 (EPA) | 0.00 g |
| PUFA 22:5 n-3 (DPA) | 0.00 g |
| PUFA 22:6 n-3 (DHA) | 0.00 g |
| Cholesterol | 0.00 mg |
FAQ
Is a breakfast bar a healthy breakfast?
It can be part of a balanced breakfast but is rarely a complete one on its own. Its high sugar and low protein/fiber profile means it won't keep you full for long. Pair it with protein (like an egg or yogurt) and fruit for a more balanced meal.
Why is it labeled 'NFS'?
'NFS' stands for 'Not Further Specified.' It's a generic data point used in nutrition databases to represent the average composition of a category of food—in this case, a standard breakfast bar—without specifying a particular brand or recipe.
How does it differ from an energy bar?
While often similar, breakfast bars are typically marketed for morning consumption and may have a more cookie-like or oat-based texture. Energy bars are often formulated with specific macronutrient ratios (higher protein, specific carbs) to fuel athletic performance.
Nutrient density (calculated · NRF9.3)
Nutrient Rich Foods index: beneficial nutrients (protein, fiber, vitamins, minerals) minus saturated fat, added sugar & sodium, per 100 kcal.
NRF9.3 index — Fulgoni, Keast & Drewnowski, 2009. Computed from USDA nutrients.
Weight-loss friendliness (composite index)
Energy density 3.76 kcal/g · 5% calories from protein · 2.1 g fiber · 35.1 g sugar per 100 g.
Composite of energy density (Rolls et al., 1999), protein & fiber satiety, minus sugar. A calculated heuristic — ranks satiety-per-calorie, not a clinical measure.
Dietary load (calculated from USDA values)
Potential renal acid load. Positive = acid-forming, negative = alkaline-forming.
Sodium-to-potassium ratio: 1.71 (lower is better — aim for ≤ 1)
Sodium:potassium per WHO potassium guidance. Computed from USDA nutrients.