

Tart, all types
Common food

Photo: Wikipedia
A tart is a baked dish consisting of a filling over a pastry base with an open top not covered with pastry. The pastry base can be shortcrust, puff, or sweet, and the filling can be sweet (like fruit, custard, or chocolate) or savory (like quiche). Nutritionally, it's a calorie-dense treat, with a typical 100g serving providing significant carbohydrates (42.6g) and fats (16.1g) for energy, but minimal protein (3g).
Calorie split: 4% protein · 52% carbs · 44% fat
↓ Full nutrition💚 Why it's loved
People love tarts for their perfect balance of buttery, flaky pastry and flavorful fillings, offering a satisfying textural contrast. Their versatility makes them a beloved centerpiece for everything from a simple afternoon tea to an elegant dessert course.
⚠️ Watch-outs & how to enjoy it better
The high sugar (21.4g per 100g) and refined carbohydrate content can lead to rapid blood-sugar spikes, making it a concern for diabetics or those managing blood glucose. To counteract this, enjoy a small portion alongside a source of protein (like Greek yogurt) or healthy fat (like a handful of nuts) to slow sugar absorption. The pastry is also a common source of gluten and may contain dairy, which are allergens for many.
Key benefits
- Provides quick energy from carbohydrates
- Can be a source of dietary fiber if made with whole-grain flour or fruit fillings
- Offers a vehicle for nutrient-rich fillings like fruits, nuts, or eggs
- Versatile for both sweet and savory meal occasions
- Culturally significant in many cuisines, often tied to celebrations.
🍽️ Popular dishes


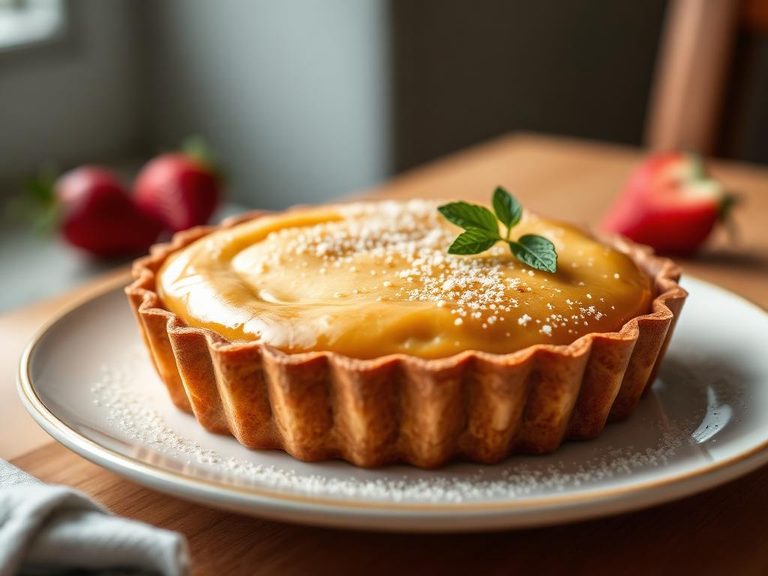
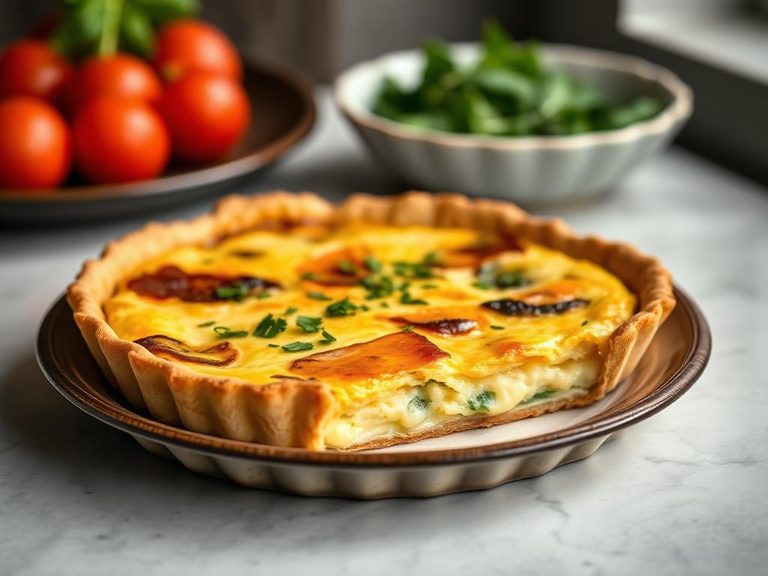
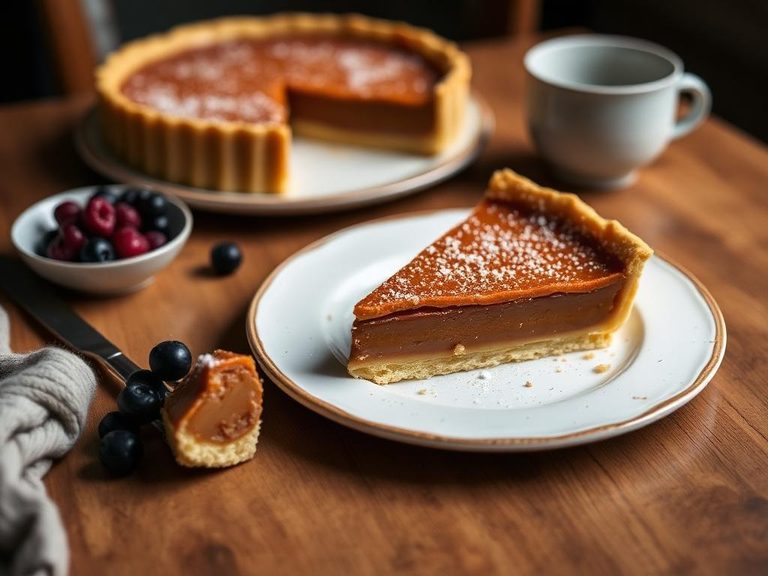
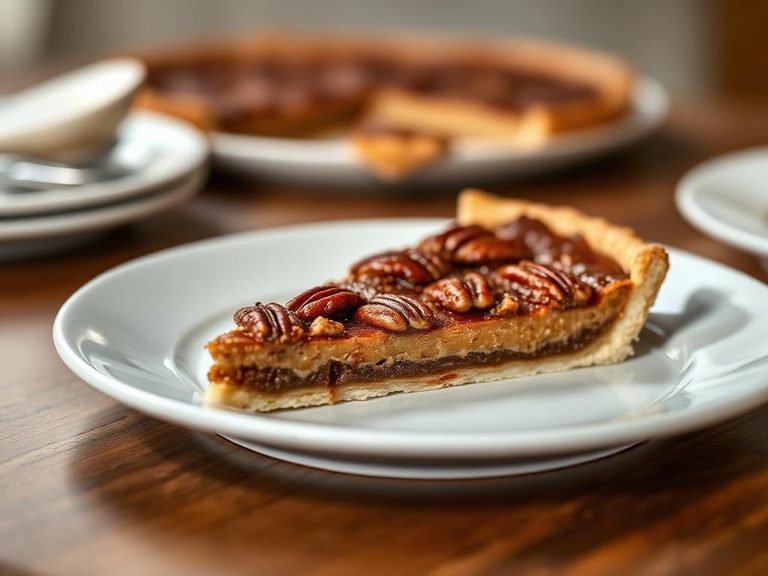
🌍 Where it's eaten
💡 Did you know?
The word 'tart' in English comes from the Old French 'tarte,' which itself likely derived from the Latin 'torta,' meaning a round, flat bread or cake.
Full nutrition (USDA data · scales with serving)
| Water | 37.6 g |
| Energy | 316 kcal |
| Protein | 3.0 g |
| Total lipid (fat) | 16.1 g |
| Carbohydrate, by difference | 42.6 g |
| Fiber, total dietary | 2.6 g |
| Total Sugars | 21.4 g |
| Calcium, Ca | 22.0 mg |
| Iron, Fe | 1.2 mg |
| Magnesium, Mg | 10.0 mg |
| Phosphorus, P | 43.0 mg |
| Potassium, K | 65.0 mg |
| Sodium, Na | 333 mg |
| Zinc, Zn | 0.23 mg |
| Copper, Cu | 0.05 mg |
| Selenium, Se | 2.4 ug |
| Vitamin C, total ascorbic acid | 1.3 mg |
| Thiamin | 0.14 mg |
| Riboflavin | 0.11 mg |
| Niacin | 1.4 mg |
| Vitamin B-6 | 0.03 mg |
| Folate, total | 18.0 ug |
| Folic acid | 15.0 ug |
| Folate, food | 3.0 ug |
| Folate, DFE | 29.0 ug |
| Choline, total | 7.2 mg |
| Vitamin B-12 | 0.08 ug |
| Vitamin B-12, added | 0.00 ug |
| Vitamin A, RAE | 5.0 ug |
| Retinol | 5.0 ug |
| Carotene, beta | 5.0 ug |
| Carotene, alpha | 0.00 ug |
| Cryptoxanthin, beta | 5.0 ug |
| Lycopene | 0.00 ug |
| Lutein + zeaxanthin | 8.0 ug |
| Vitamin E (alpha-tocopherol) | 1.7 mg |
| Vitamin E, added | 0.00 mg |
| Vitamin D (D2 + D3) | 0.00 ug |
| Vitamin K (phylloquinone) | 4.1 ug |
| Alcohol, ethyl | 0.00 g |
| Caffeine | 0.00 mg |
| Theobromine | 0.00 mg |
Fat & fatty acid profile (per 100g)
| Fatty acids, total saturated | 2.5 g |
| SFA 4:0 | 0.00 g |
| SFA 6:0 | 0.00 g |
| SFA 8:0 | 0.00 g |
| SFA 10:0 | 0.00 g |
| SFA 12:0 | 0.00 g |
| SFA 14:0 | 0.03 g |
| SFA 16:0 | 1.5 g |
| SFA 18:0 | 0.83 g |
| Fatty acids, total monounsaturated | 7.4 g |
| MUFA 16:1 | 0.01 g |
| MUFA 18:1 | 7.3 g |
| MUFA 20:1 | 0.09 g |
| MUFA 22:1 | 0.03 g |
| Fatty acids, total polyunsaturated | 5.4 g |
| PUFA 18:2 | 4.8 g |
| PUFA 18:3 | 0.57 g |
| PUFA 18:4 | 0.00 g |
| PUFA 20:4 | 0.00 g |
| PUFA 20:5 n-3 (EPA) | 0.00 g |
| PUFA 22:5 n-3 (DPA) | 0.00 g |
| PUFA 22:6 n-3 (DHA) | 0.00 g |
| Cholesterol | 0.00 mg |
FAQ
What's the difference between a tart and a pie?
Traditionally, a pie has a pastry lid and is often deeper-dish, while a tart is open-faced, shallower, and often baked in a straight-sided, removable-bottom pan. The pastry for a tart (like pâte sucrée) is often more cookie-like and sturdy.
Can I make a tart healthier?
Yes. Use a whole-wheat or almond-flour crust, reduce the sugar in the filling by 25-30%, and load it with fresh fruit. For savory tarts, use vegetables and lean proteins, and opt for a cheese with lower fat content.
How should I store leftover tart?
Fruit tarts are best eaten the day they are made. If stored, cover loosely and refrigerate for up to 2 days. Custard or cream-based tarts must be refrigerated and consumed within 1-2 days for food safety.
Nutrient density (calculated · NRF9.3)
Nutrient Rich Foods index: beneficial nutrients (protein, fiber, vitamins, minerals) minus saturated fat, added sugar & sodium, per 100 kcal.
NRF9.3 index — Fulgoni, Keast & Drewnowski, 2009. Computed from USDA nutrients.
Weight-loss friendliness (composite index)
Energy density 3.16 kcal/g · 4% calories from protein · 2.6 g fiber · 21.4 g sugar per 100 g.
Composite of energy density (Rolls et al., 1999), protein & fiber satiety, minus sugar. A calculated heuristic — ranks satiety-per-calorie, not a clinical measure.
Dietary load (calculated from USDA values)
Potential renal acid load. Positive = acid-forming, negative = alkaline-forming.
Sodium-to-potassium ratio: 5.12 (lower is better — aim for ≤ 1)
Sodium:potassium per WHO potassium guidance. Computed from USDA nutrients.