

Caesar dressing, fat free
Common food

Photo: Wikipedia
A light, tangy, and creamy condiment that delivers the classic savory, garlicky, and lemony Caesar flavor profile without the traditional fat. Its texture is smooth and pourable, designed to coat greens evenly. Nutritionally, it's notable for being extremely low in fat and calories while providing a significant source of carbohydrates.
Calorie split: 4% protein · 94% carbs · 2% fat
↓ Full nutrition💚 Why it's loved
People love it for delivering the iconic, bold, umami-rich taste of a Caesar salad—garlic, anchovy, lemon, and Parmesan notes—without the heavy calorie load of a traditional oil-based dressing. Its versatility makes it a popular choice for lightening up wraps, sandwiches, and vegetable dips.
⚠️ Watch-outs & how to enjoy it better
The high carbohydrate content (30.73g per 100g), largely from added sugars (8.82g), can cause rapid blood-sugar spikes, making it less ideal for those monitoring glucose levels. It also typically contains significant sodium and common allergens like anchovy (fish) and dairy (Parmesan). To counteract, pair it with protein and healthy fats (like grilled chicken or avocado) to slow sugar absorption, practice strict portion control, and always check labels for specific allergen warnings.
Key benefits
- Very low in fat and calories (0.23g fat, 131 kcal per 100g)
- Provides a quick source of energy from carbohydrates (30.73g per 100g)
- Low in protein and fiber, making it a light condiment choice
- Allows for classic Caesar salad enjoyment with reduced dietary fat intake
🍽️ Popular dishes
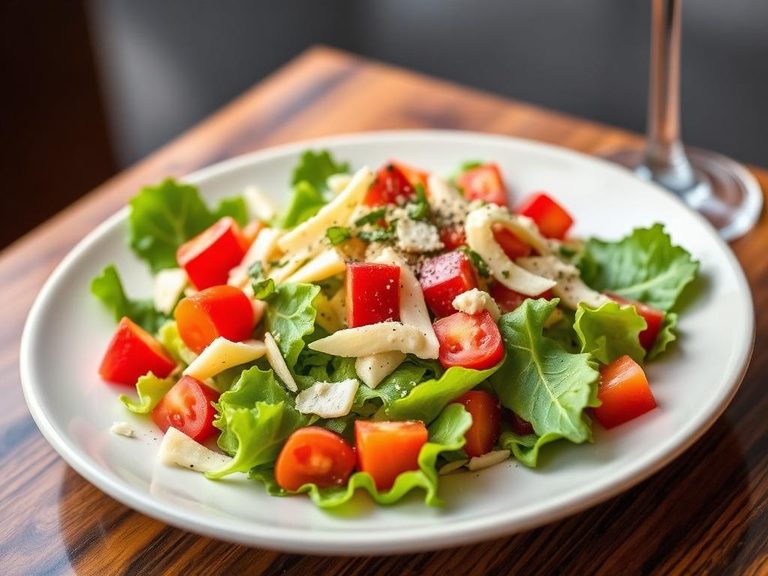
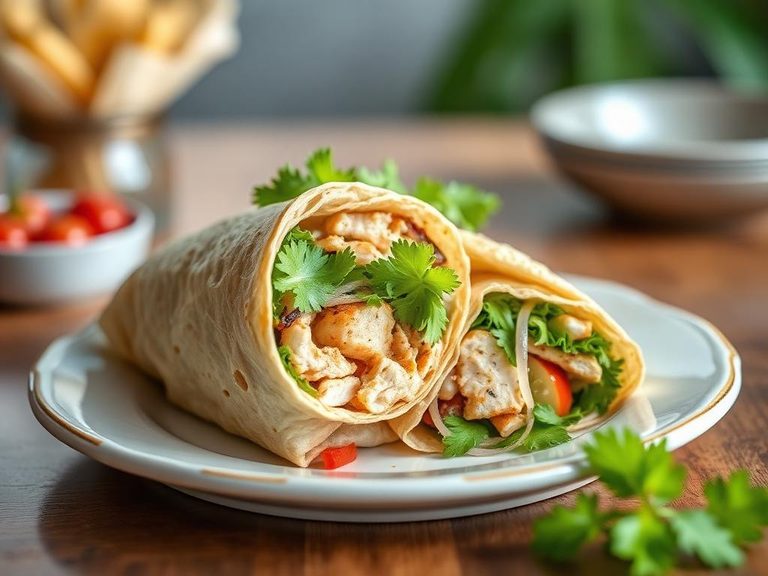
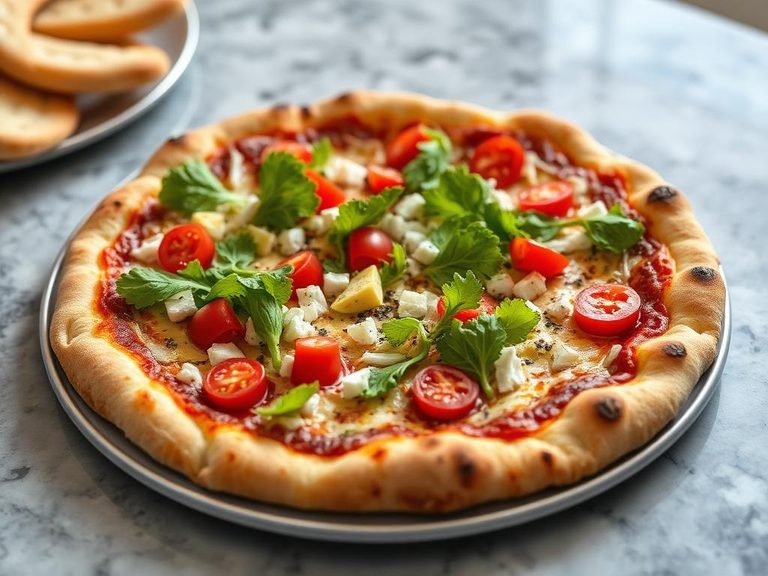

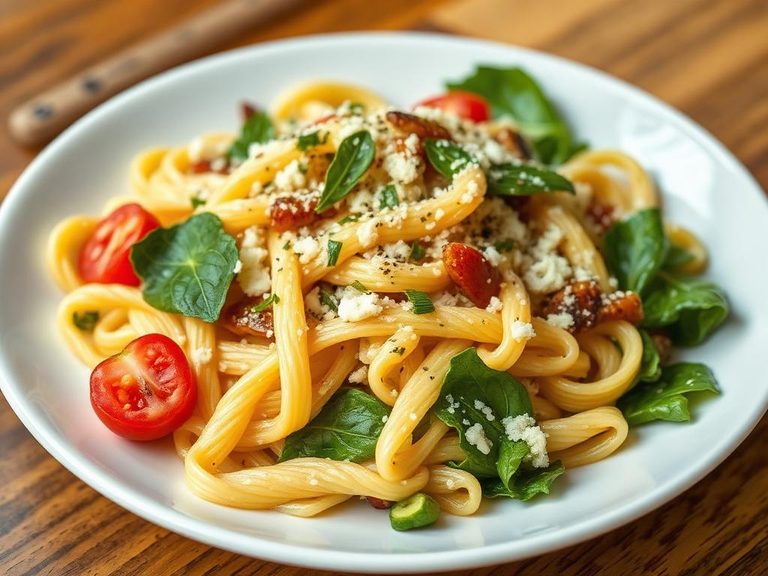
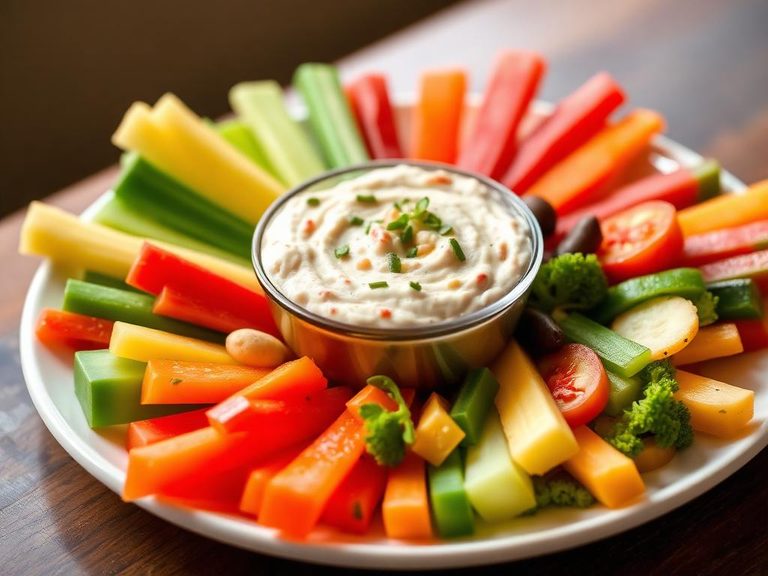
🌍 Where it's eaten
💡 Did you know?
The original Caesar salad was invented in Tijuana, Mexico, by Italian-American restaurateur Caesar Cardini, and the authentic recipe actually contains no anchovies—the 'umami' flavor came from Worcestershire sauce.
Full nutrition (USDA data · scales with serving)
| Water | 64.1 g |
| Energy | 131 kcal |
| Protein | 1.5 g |
| Total lipid (fat) | 0.23 g |
| Carbohydrate, by difference | 30.7 g |
| Fiber, total dietary | 0.20 g |
| Total Sugars | 8.8 g |
| Calcium, Ca | 33.0 mg |
| Iron, Fe | 0.29 mg |
| Magnesium, Mg | 4.0 mg |
| Phosphorus, P | 30.0 mg |
| Potassium, K | 48.0 mg |
| Sodium, Na | 1265 mg |
| Zinc, Zn | 0.30 mg |
| Copper, Cu | 0.02 mg |
| Selenium, Se | 2.2 ug |
| Vitamin C, total ascorbic acid | 0.10 mg |
| Thiamin | 0.03 mg |
| Riboflavin | 0.01 mg |
| Niacin | 0.03 mg |
| Vitamin B-6 | 0.04 mg |
| Folate, total | 2.0 ug |
| Folic acid | 0.00 ug |
| Folate, food | 2.0 ug |
| Folate, DFE | 2.0 ug |
| Choline, total | 2.4 mg |
| Vitamin B-12 | 0.04 ug |
| Vitamin B-12, added | 0.00 ug |
| Vitamin A, RAE | 1.0 ug |
| Retinol | 1.0 ug |
| Carotene, beta | 0.00 ug |
| Carotene, alpha | 0.00 ug |
| Cryptoxanthin, beta | 0.00 ug |
| Lycopene | 0.00 ug |
| Lutein + zeaxanthin | 0.00 ug |
| Vitamin E (alpha-tocopherol) | 0.02 mg |
| Vitamin E, added | 0.00 mg |
| Vitamin D (D2 + D3) | 0.00 ug |
| Vitamin K (phylloquinone) | 0.00 ug |
| Alcohol, ethyl | 0.00 g |
| Caffeine | 0.00 mg |
| Theobromine | 0.00 mg |
Fat & fatty acid profile (per 100g)
| Fatty acids, total saturated | 0.10 g |
| SFA 4:0 | 0.01 g |
| SFA 6:0 | 0.00 g |
| SFA 8:0 | 0.00 g |
| SFA 10:0 | 0.00 g |
| SFA 12:0 | 0.00 g |
| SFA 14:0 | 0.01 g |
| SFA 16:0 | 0.04 g |
| SFA 18:0 | 0.02 g |
| Fatty acids, total monounsaturated | 0.04 g |
| MUFA 16:1 | 0.00 g |
| MUFA 18:1 | 0.04 g |
| MUFA 20:1 | 0.00 g |
| MUFA 22:1 | 0.00 g |
| Fatty acids, total polyunsaturated | 0.01 g |
| PUFA 18:2 | 0.01 g |
| PUFA 18:3 | 0.00 g |
| PUFA 18:4 | 0.00 g |
| PUFA 20:4 | 0.00 g |
| PUFA 20:5 n-3 (EPA) | 0.00 g |
| PUFA 22:5 n-3 (DPA) | 0.00 g |
| PUFA 22:6 n-3 (DHA) | 0.00 g |
| Cholesterol | 1.0 mg |
FAQ
How does fat-free Caesar dressing differ from regular Caesar dressing?
Fat-free versions replace the traditional olive oil base with water, thickeners, and often more sugar or carbohydrates to maintain texture and flavor, resulting in drastically lower fat and calories but higher carbs.
Is fat-free Caesar dressing suitable for a low-carb or keto diet?
Generally, no. With over 30g of carbohydrates per 100g, it is not compatible with standard low-carb or ketogenic dietary guidelines.
Does it taste the same as regular Caesar dressing?
It aims for a similar flavor profile but often lacks the rich mouthfeel and depth of a full-fat version. The taste can be tangier and slightly sweeter due to the different ingredient base.
Nutrient density (calculated · NRF9.3)
Nutrient Rich Foods index: beneficial nutrients (protein, fiber, vitamins, minerals) minus saturated fat, added sugar & sodium, per 100 kcal.
NRF9.3 index — Fulgoni, Keast & Drewnowski, 2009. Computed from USDA nutrients.
Weight-loss friendliness (composite index)
Energy density 1.31 kcal/g · 4% calories from protein · 0.2 g fiber · 8.8 g sugar per 100 g.
Composite of energy density (Rolls et al., 1999), protein & fiber satiety, minus sugar. A calculated heuristic — ranks satiety-per-calorie, not a clinical measure.
Dietary load (calculated from USDA values)
Potential renal acid load. Positive = acid-forming, negative = alkaline-forming.
Sodium-to-potassium ratio: 26.35 (lower is better — aim for ≤ 1)
Sodium:potassium per WHO potassium guidance. Computed from USDA nutrients.