

Pretzel chips, hard, flavored
Common food

Photo: Wikipedia
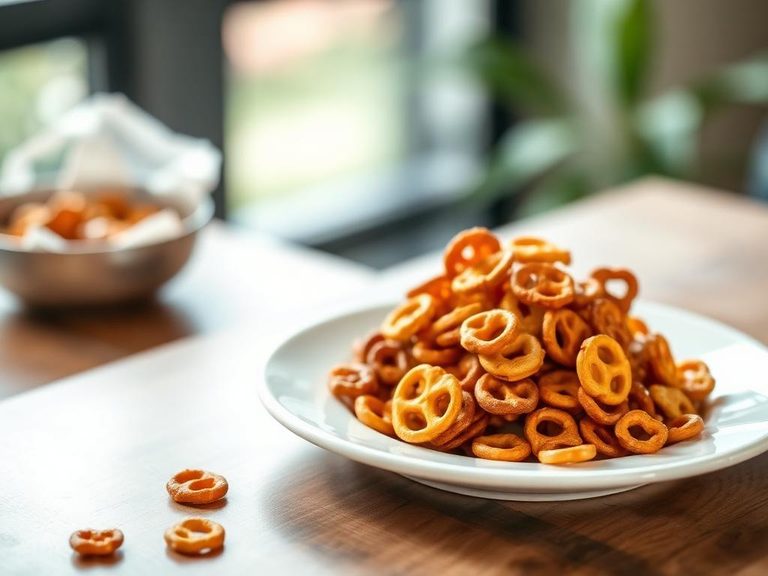
Pretzel chips are a crunchy, baked or fried snack made from pretzel dough, sliced thin and seasoned. They offer a satisfying salty crunch with a distinct malty, toasted wheat flavor, often enhanced by seasonings like garlic, cheese, or spicy blends. Nutritionally, they are a high-carbohydrate, low-fat snack that provides a quick energy source.
Calorie split: 10% protein · 83% carbs · 7% fat
↓ Full nutrition💚 Why it's loved
People love pretzel chips for their addictive, satisfying crunch and the deep, savory, malty flavor that sets them apart from other snacks. Their versatility makes them a perfect vehicle for dips, from classic mustard to hummus, and they are a staple at parties, movie nights, and as a casual on-the-go snack.
⚠️ Watch-outs & how to enjoy it better
The primary downside is their high carbohydrate content and low fiber/protein ratio, which can lead to rapid blood-sugar spikes, making them a poor choice for those managing diabetes or seeking sustained energy. They are also typically high in sodium, which can be problematic for blood pressure, and are made from wheat, a common allergen. To counteract blood-sugar spikes, pair them with a protein or healthy fat source like hummus, cheese, or nuts, and practice strict portion control.
Key benefits
- Provides a quick source of energy from complex carbohydrates
- Very low in fat, especially saturated fat
- Contains some dietary fiber for digestive health
- Offers a small amount of plant-based protein
- A crunchy, satisfying alternative to potato chips
🍽️ Popular dishes
🌍 Where it's eaten
💡 Did you know?
The unique, glossy brown crust and distinctive flavor of traditional pretzels (the base for these chips) come from briefly dipping the dough in a lye or baking soda solution before baking, a process called 'pretzeling'.
Full nutrition (USDA data · scales with serving)
| Water | 3.0 g |
| Energy | 370 kcal |
| Protein | 9.7 g |
| Total lipid (fat) | 2.8 g |
| Carbohydrate, by difference | 77.5 g |
| Fiber, total dietary | 3.3 g |
| Total Sugars | 2.1 g |
| Calcium, Ca | 28.0 mg |
| Iron, Fe | 4.4 mg |
| Magnesium, Mg | 28.0 mg |
| Phosphorus, P | 123 mg |
| Potassium, K | 215 mg |
| Sodium, Na | 2461 mg |
| Zinc, Zn | 1.0 mg |
| Copper, Cu | 0.15 mg |
| Selenium, Se | 4.2 ug |
| Vitamin C, total ascorbic acid | 2.0 mg |
| Thiamin | 0.41 mg |
| Riboflavin | 0.32 mg |
| Niacin | 5.1 mg |
| Vitamin B-6 | 0.07 mg |
| Folate, total | 165 ug |
| Folic acid | 85.0 ug |
| Folate, food | 80.0 ug |
| Folate, DFE | 225 ug |
| Choline, total | 28.4 mg |
| Vitamin B-12 | 0.00 ug |
| Vitamin B-12, added | 0.00 ug |
| Vitamin A, RAE | 0.00 ug |
| Retinol | 0.00 ug |
| Carotene, beta | 0.00 ug |
| Carotene, alpha | 0.00 ug |
| Cryptoxanthin, beta | 0.00 ug |
| Lycopene | 0.00 ug |
| Lutein + zeaxanthin | 9.0 ug |
| Vitamin E (alpha-tocopherol) | 0.45 mg |
| Vitamin E, added | 0.00 mg |
| Vitamin D (D2 + D3) | 0.00 ug |
| Vitamin K (phylloquinone) | 2.7 ug |
| Alcohol, ethyl | 0.00 g |
| Caffeine | 0.00 mg |
| Theobromine | 0.00 mg |
Fat & fatty acid profile (per 100g)
| Fatty acids, total saturated | 0.38 g |
| SFA 4:0 | 0.00 g |
| SFA 6:0 | 0.00 g |
| SFA 8:0 | 0.00 g |
| SFA 10:0 | 0.00 g |
| SFA 12:0 | 0.00 g |
| SFA 14:0 | 0.00 g |
| SFA 16:0 | 0.31 g |
| SFA 18:0 | 0.05 g |
| Fatty acids, total monounsaturated | 0.70 g |
| MUFA 16:1 | 0.00 g |
| MUFA 18:1 | 0.68 g |
| MUFA 20:1 | 0.01 g |
| MUFA 22:1 | 0.00 g |
| Fatty acids, total polyunsaturated | 1.2 g |
| PUFA 18:2 | 1.2 g |
| PUFA 18:3 | 0.06 g |
| PUFA 18:4 | 0.00 g |
| PUFA 20:4 | 0.00 g |
| PUFA 20:5 n-3 (EPA) | 0.00 g |
| PUFA 22:5 n-3 (DPA) | 0.00 g |
| PUFA 22:6 n-3 (DHA) | 0.00 g |
| Cholesterol | 0.00 mg |
FAQ
Are pretzel chips healthier than potato chips?
Generally, yes. Pretzel chips are typically lower in fat and calories than fried potato chips. However, they are often higher in sodium and carbohydrates, so 'healthier' depends on your specific dietary goals.
Why are pretzel chips so hard and crunchy?
Their texture comes from the dough being rolled very thin and then baked or fried until completely dehydrated and crisp. The low moisture content is key to their signature snap.
Can I make pretzel chips at home?
Absolutely. You can slice store-bought pretzels very thinly, toss them with a little oil and salt, and bake until crisp. Alternatively, you can make pretzel dough from scratch, roll it paper-thin, cut it, and bake.
Nutrient density (calculated · NRF9.3)
Nutrient Rich Foods index: beneficial nutrients (protein, fiber, vitamins, minerals) minus saturated fat, added sugar & sodium, per 100 kcal.
NRF9.3 index — Fulgoni, Keast & Drewnowski, 2009. Computed from USDA nutrients.
Weight-loss friendliness (composite index)
Energy density 3.70 kcal/g · 10% calories from protein · 3.3 g fiber · 2.1 g sugar per 100 g.
Composite of energy density (Rolls et al., 1999), protein & fiber satiety, minus sugar. A calculated heuristic — ranks satiety-per-calorie, not a clinical measure.
Dietary load (calculated from USDA values)
Potential renal acid load. Positive = acid-forming, negative = alkaline-forming.
Sodium-to-potassium ratio: 11.45 (lower is better — aim for ≤ 1)
Sodium:potassium per WHO potassium guidance. Computed from USDA nutrients.